Bank of America 2001 Annual Report Download - page 99
Download and view the complete annual report
Please find page 99 of the 2001 Bank of America annual report below. You can navigate through the pages in the report by either clicking on the pages listed below, or by using the keyword search tool below to find specific information within the annual report.-
 1
1 -
2
-
3
-
4
-
5
-
6
-
7
-
8
-
9
-
10
-
11
-
12
-
13
-
14
-
15
-
16
-
17
-
18
-
19
-
20
-
21
-
22
-
23
-
24
-
25
-
26
-
27
-
28
-
29
-
30
-
31
-
32
-
33
-
34
-
35
-
36
-
37
-
38
-
39
-
40
-
41
-
42
-
43
-
44
-
45
-
46
-
47
-
48
-
49
-
50
-
51
-
52
-
53
-
54
-
55
-
56
-
57
-
58
-
59
-
60
-
61
-
62
-
63
-
64
-
65
-
66
-
67
-
68
-
69
-
70
-
71
-
72
-
73
-
74
-
75
-
76
-
77
-
78
-
79
-
80
-
81
-
82
-
83
-
84
-
85
-
86
-
87
-
88
-
 89
89 -
 90
90 -
 91
91 -
 92
92 -
 93
93 -
 94
94 -
 95
95 -
 96
96 -
 97
97 -
 98
98 -
 99
99 -
 100
100 -
 101
101 -
 102
102 -
 103
103 -
 104
104 -
 105
105 -
 106
106 -
 107
107 -
 108
108 -
 109
109 -
110
-
111
-
112
-
113
-
114
-
115
-
116
-
117
-
118
-
119
-
120
-
121
-
122
-
123
-
124
 |
 |

BANK OF AMERICA 2001 ANNUAL REPORT
97
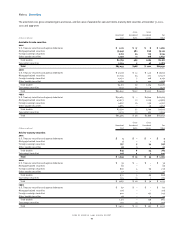
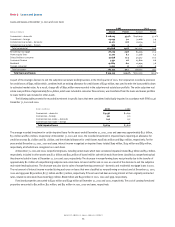
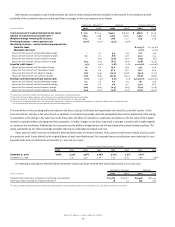
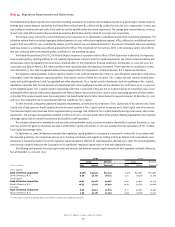
The Corporation reviews its loan and lease portfolio on a managed basis. Managed loans and leases include on-balance sheet loans and leases as
well as securitized loans originated by the Corporation for which the possibility exists that the loans will return to the Corporation at the end of the secu-
ritization. Portfolio balances, delinquency and historical loss amounts for the managed loan and lease portfolio for 2001 and 2000 were as follows:
December 31, 2001 December 31, 2000
(1)
Total Principal Principal Principal Total Principal Principal Principal
Amount of Amount of Loans Amount of Amount of Amount of Loans Amount of
Loans and Past Due Nonperforming Loans and Past Due Nonperforming
(Dollars in millions)
Leases 90 Days or More
(2)
Loans Leases 90 Days or More
(2)
Loans
Commercial – domestic $ 120,159 $ 175 $ 3,123 $145,990 $ 141 $ 2,777
Commercial – foreign 23,039 6 461 30,285 37 486
Commercial real estate – domestic 22,271 40 240 26,154 16 236
Commercial real estate – foreign 384 – 3 282 – 2
Total commercial 165,853 221 3,827 202,711 194 3,501
Residential mortgage 80,071 14 564 72,393 17 557
Home equity lines 22,107 – 80 21,598 – 33
Direct/Indirect consumer 38,037 92 27 39,714 85 19
Consumer finance 5,331 24 9 5,898 5 2
Bankcard 27,185 475 – 22,830 358 –
Foreign consumer 2,092 – 7 2,308 – 9
Total consumer 174,823 605 687 164,741 465 620
Total managed loans and leases 340,676 $ 826 $ 4,514 $367,452 $ 659 $ 4,121
Securitized loans 11,523
Total held loans and leases $ 329,153
Year Ended December 31, 2001 Year Ended December 31, 2000
(1)
Average Average
Loans and Loans and Loans and Loans and
Leases Leases Net Net Loss Leases Leases Net Net Loss
(Dollars in millions)
Outstanding Losses Ratio
(3)
Outstanding Losses Ratio
(3)
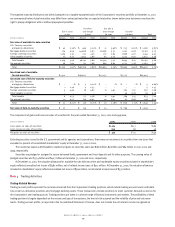
Commercial – domestic $ 135,750 $ 1,949 1.44% $147,947 $ 1,287 0.87%
Commercial – foreign 26,492 208 0.79 28,880 86 0.30
Commercial real estate – domestic 24,607 39 0.16 25,381 13 0.06
Commercial real estate – foreign 348 – n/m 304 (2) n/m
Total commercial 187,197 2,196 1.17 202,512 1,384 0.68
Residential mortgage 84,005 26 0.03 79,440 27 0.03
Home equity lines 22,013 19 0.09 19,492 20 0.10
Direct/Indirect consumer 40,051 409 1.02 39,743 376 0.95
Consumer finance 18,555 1,066 5.75 16,219 266 1.64
Bankcard 24,637 1,174 4.76 20,222 944 4.66
Foreign consumer 2,222 5 0.23 2,223 3 0.13
Total consumer 191,483 2,699 1.41 177,339 1,636 0.92
Total managed loans and leases 378,680 $4,895 1.29% $379,851 $3,020 0.80%
Securitized loans 13,233
Total held loans and leases $365,447
n/m = not meaningful
(1) Prior periods are restated for comparison (e.g., acquisitions, divestitures, sales, securitizations and the transfer of the subprime real estate loan portfolio to
loans held for sale in the third quarter of 2001).
(2) Excluding residential mortgages, loans are performing and still accruing interest.
(3) The net loss ratio is calculated by dividing managed loans and leases net losses by average managed loans and leases outstanding for each loans and leases category.