Bank of America 2001 Annual Report Download - page 31
Download and view the complete annual report
Please find page 31 of the 2001 Bank of America annual report below. You can navigate through the pages in the report by either clicking on the pages listed below, or by using the keyword search tool below to find specific information within the annual report.-
 1
1 -
2
-
3
-
4
-
5
-
6
-
7
-
8
-
9
-
10
-
11
-
12
-
13
-
14
-
15
-
16
-
17
-
18
-
19
-
20
-
 21
21 -
 22
22 -
 23
23 -
 24
24 -
 25
25 -
 26
26 -
 27
27 -
 28
28 -
 29
29 -
 30
30 -
 31
31 -
 32
32 -
 33
33 -
 34
34 -
 35
35 -
 36
36 -
 37
37 -
 38
38 -
 39
39 -
 40
40 -
 41
41 -
42
-
43
-
44
-
45
-
46
-
47
-
48
-
49
-
50
-
51
-
52
-
53
-
54
-
55
-
56
-
57
-
58
-
59
-
60
-
61
-
62
-
63
-
64
-
65
-
66
-
67
-
68
-
69
-
70
-
71
-
72
-
73
-
74
-
75
-
76
-
77
-
78
-
79
-
80
-
81
-
82
-
83
-
84
-
85
-
86
-
87
-
88
-
89
-
90
-
91
-
92
-
93
-
94
-
95
-
96
-
97
-
98
-
99
-
100
-
101
-
102
-
103
-
104
-
105
-
106
-
107
-
108
-
109
-
110
-
111
-
112
-
113
-
114
-
115
-
116
-
117
-
118
-
119
-
120
-
121
-
122
-
123
-
124
 |
 |

29
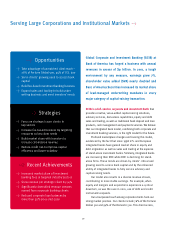
combined with our array of high-margin, high-return products
and services, supported by our corporate financial strength,
gives us enormous advantages in the marketplace, where we
use the brand name Banc of America Securities.
We are focusing our resources on industry
sectors where we can establish leading positions,
substantially increase fee generation, grow our
market-making and commission revenues and
improve the efficiency of our capital. We expect
to broaden and deepen our targeted client rela-
tionships to include our full array of advisory,
capital-raising, risk-management and treasury-
services capabilities.
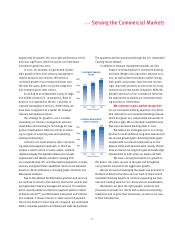
Building on our strong momentum from 2000,
we aggressively pursued our growth strategy in
2001. In just three years we have achieved higher
league table rankings and a larger share of lead-
managed deals and total investment banking
fees. We estimate that in 2001 Banc of America
Securities’ share of total U.S. issuer fees grew
to 5.9% versus 4.7% in 2000 and 3.9% in 1999,
evidence of our successful execution. Today,
according to an independent research company,
we are the sixth-ranked U.S. investment bank in
terms of lead relationships among all large U.S.
corporate clients.
We are executing specific strategies related to both
our issuer and investor clients. Our strategy for issuer clients
contains several elements. First, we are building substantial
expertise around eight key industry groups that generate signifi-
cant fees and possess strong long-term growth potential. We are
leveraging relationships in these sectors to win
investment banking mandates and build leading
market positions. Since 1999, we have had an over-
all increase in the market share of estimated invest-
ment banking fees in our targeted industry sectors.
Second, we have created teams within each
industry group that encompass both corporate
and investment banking expertise. Each team
works across product areas, from traditional
bank and loan products to sophisticated capital
raising, advisory and derivatives capabilities, to
deliver a seamless experience for clients and
deepen each relationship. This has resulted in
significantly more diversified revenue streams
earned from our corporate banking client base.
Third, while we have broad client reach, we
are focusing on strategic clients within our key
sectors to expand fee generation and profit
potential. Today there are nearly 400 such clients
who share our commitment to a relationship
that is mutually beneficial. Our broad range of
market-leading capabilities combined with our
in-depth knowledge of each client’s needs provides
ample ways to serve such a relationship. Today, more than
one-third of these clients regard us as their lead investment
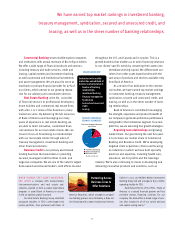
Our extensive product array combined with superior financial strength
enables us to create innovative financial solutions for corporate clients who are
increasingly seeking providers with multi-faceted capabilities.
$1.5
$9.2
$1.2
$2.3
$2.6
$1.6
(Dollars in billions)
capital raising and advisory fees
equity sales and trading
debt sales and trading
credit products
global treasury services
GCIB REVENUE 2001
GCIB FINANCIAL PERFORMANCE
■
2000
■
2001
$8.2
$1.8
$0.3
$0.6
$1.9$9.2
Revenue SVANet Income
(Dollars in billions)
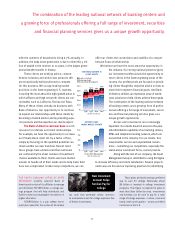
IN EXECUTING our originate-to-distribute
strategy, portfolio managers, with authority
over loan underwriting decisions, bring an
investor perspective to discussions to ensure
that loans are attractive for both our portfolio
and the broader market.
While continuing to meet the borrowing
needs of our targeted issuer clients, we have sig-
nificantly reduced corporate loan balances
since mid-2000. We closely examine returns from
each client, seeking to retain and solidify only
relationships that are mutually beneficial. We
also limit concentrated exposure across clients,
industries and geographies, selling loans when
necessary to maintain a maximum threshold. We
have aggressively attacked our problem loan
portfolio through both collections and sales.
Deploying our credit capital resources to our
most profitable relationships while maintaining
lower loan asset levels will lead to higher returns
on credit capital and less risk exposure, driving
growth in shareholder value added.
Portfolio
Management Will
Drive SVA Growth