Bank of America 2001 Annual Report Download - page 118
Download and view the complete annual report
Please find page 118 of the 2001 Bank of America annual report below. You can navigate through the pages in the report by either clicking on the pages listed below, or by using the keyword search tool below to find specific information within the annual report.-
 1
1 -
2
-
3
-
4
-
5
-
6
-
7
-
8
-
9
-
10
-
11
-
12
-
13
-
14
-
15
-
16
-
17
-
18
-
19
-
20
-
21
-
22
-
23
-
24
-
25
-
26
-
27
-
28
-
29
-
30
-
31
-
32
-
33
-
34
-
35
-
36
-
37
-
38
-
39
-
40
-
41
-
42
-
43
-
44
-
45
-
46
-
47
-
48
-
49
-
50
-
51
-
52
-
53
-
54
-
55
-
56
-
57
-
58
-
59
-
60
-
61
-
62
-
63
-
64
-
65
-
66
-
67
-
68
-
69
-
70
-
71
-
72
-
73
-
74
-
75
-
76
-
77
-
78
-
79
-
80
-
81
-
82
-
83
-
84
-
85
-
86
-
87
-
88
-
89
-
90
-
91
-
92
-
93
-
94
-
95
-
96
-
97
-
98
-
99
-
100
-
101
-
102
-
103
-
104
-
105
-
106
-
107
-
 108
108 -
 109
109 -
 110
110 -
 111
111 -
 112
112 -
 113
113 -
 114
114 -
 115
115 -
 116
116 -
 117
117 -
 118
118 -
 119
119 -
 120
120 -
 121
121 -
 122
122 -
 123
123 -
 124
124
 |
 |

BANK OF AMERICA 2001 ANNUAL REPORT
116
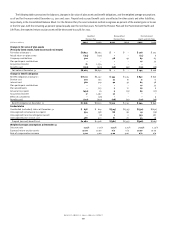
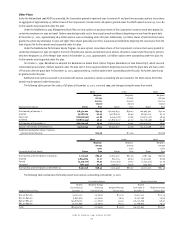
The following table includes total revenue and net income for the years ended December 31, 2001, 2000 and 1999, and total assets at December 31,
2001 and 2000 for each business segment. Certain prior period amounts have been reclassified between segments to conform to the current period
presentation.
Business Segments
For the year ended December 31
Consumer and
Total Corporation Commercial Banking
(1)
(Dollars in millions)
2001 2000 1999 2001 2000 1999
Net interest income(2) $ 20,633 $ 18,671 $ 18,342 $ 13,364 $ 12,620 $ 12,851
Noninterest income(3) 14,348 14,582 14,179 8,008 7,356 7,160
Total revenue 34,981 33,253 32,521 21,372 19,976 20,011
Provision for credit losses 4,287 2,535 1,820 1,802 1,111 1,118
Gains (losses) on sales of securities 475 25 240 3–48
Amortization of intangibles 878 864 888 637 649 673
Other noninterest expense 19,831 17,769 17,623 11,048 10,684 11,027
Income before income taxes 10,460 12,110 12,430 7,888 7,532 7,241
Income tax expense 3,668 4,593 4,548 3,046 2,981 2,723
Net income $6,792 $ 7,517 $ 7,882 $ 4,842 $ 4,551 $ 4,518
Period-end total assets $621,764 $642,191 $304,874 $287,013
For the year ended December 31
Global Corporate and
Asset Management
(1)
Investment Banking
(1)
(Dollars in millions)
2001 2000 1999 2001 2000 1999
Net interest income(2) $741 $ 666 $ 610 $4,592 $ 3,725 $ 3,407
Noninterest income(3) 1,733 1,801 1,667 4,639 4,444 4,104
Total revenue 2,474 2,467 2,277 9,231 8,169 7,511
Provision for credit losses 121 47 99 1,275 751 213
Gains (losses) on sales of securities –––(45) (15) 9
Amortization of intangibles 57 30 31 143 138 137
Other noninterest expense 1,482 1,431 1,388 5,013 4,687 4,331
Income before income taxes 814 959 759 2,755 2,578 2,839
Income tax expense 293 370 280 876 819 916
Net income $521 $ 589 $ 479 $1,879 $ 1,759 $ 1,923
Period-end total assets $ 26,810 $ 27,140 $194,146 $206,820
For the year ended December 31
Equity Investments
(1)
Corporate Other
(Dollars in millions)
2001 2000 1999 2001 2000 1999
Net interest income(2) $ (151) $ (139) $ (83) $2,087 $ 1,799 $ 1,557
Noninterest income(3) 183 1,007 777 (215) (26) 471
Total revenue 32 868 694 1,872 1,773 2,028
Provision for credit losses(4) 84251,081 622 365
Gains (losses) on sales of securities –––517 40 183
Amortization of intangibles 10 11 11 31 36 36
Other noninterest expense(4) 174 101 124 2,114 866 753
Income before income taxes (160) 752 534 (837) 289 1,057
Income tax expense (66) 291 203 (481) 132 426
Net income $ (94) $ 461 $ 331 $ (356) $ 157 $ 631
Period-end total assets $ 6,230 $ 6,691 $ 89,704 $114,527
(1) There were no material intersegment revenues among the segments.
(2) Net interest income is presented on a taxable-equivalent basis and includes taxable-equivalent basis adjustments of $343 million, $322 million, and $215 million in 2001,
2000 and 1999, respectively.
(3) Noninterest income included the $83 million SFAS 133 transition adjustment net loss which was recorded in trading account profits in 2001. The components of the
transition adjustment by segment were a gain of $4 million for Consumer and Commercial Banking, a gain of $19 million for Global Corporate and Investment Banking and
a loss of $106 million for Corporate Other.
(4) Corporate Other includes exit charges consisting of provision for credit losses of $395 million and noninterest expense of $1,305 million related to the exit of certain
consumer finance businesses in 2001 and merger and restructuring charges in noninterest expense of $550 million and $525 million in 2000 and 1999,respectively.