Bank of America 2001 Annual Report Download - page 119
Download and view the complete annual report
Please find page 119 of the 2001 Bank of America annual report below. You can navigate through the pages in the report by either clicking on the pages listed below, or by using the keyword search tool below to find specific information within the annual report.-
 1
1 -
2
-
3
-
4
-
5
-
6
-
7
-
8
-
9
-
10
-
11
-
12
-
13
-
14
-
15
-
16
-
17
-
18
-
19
-
20
-
21
-
22
-
23
-
24
-
25
-
26
-
27
-
28
-
29
-
30
-
31
-
32
-
33
-
34
-
35
-
36
-
37
-
38
-
39
-
40
-
41
-
42
-
43
-
44
-
45
-
46
-
47
-
48
-
49
-
50
-
51
-
52
-
53
-
54
-
55
-
56
-
57
-
58
-
59
-
60
-
61
-
62
-
63
-
64
-
65
-
66
-
67
-
68
-
69
-
70
-
71
-
72
-
73
-
74
-
75
-
76
-
77
-
78
-
79
-
80
-
81
-
82
-
83
-
84
-
85
-
86
-
87
-
88
-
89
-
90
-
91
-
92
-
93
-
94
-
95
-
96
-
97
-
98
-
99
-
100
-
101
-
102
-
103
-
104
-
105
-
106
-
107
-
108
-
 109
109 -
 110
110 -
 111
111 -
 112
112 -
 113
113 -
 114
114 -
 115
115 -
 116
116 -
 117
117 -
 118
118 -
 119
119 -
 120
120 -
 121
121 -
 122
122 -
 123
123 -
 124
124
 |
 |

BANK OF AMERICA 2001 ANNUAL REPORT
117
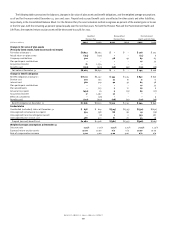
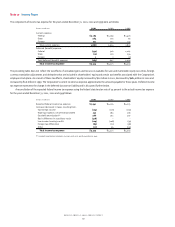
Following is a reconciliation of the four business segments’ revenue and net income for the years ended December 31, 2001, 2000 and 1999 and total
assets at December 31, 2001 and 2000 to the consolidated totals:
(Dollars in millions)
2001 2000 1999
Segments’ revenue $ 33,109 $ 31,480 $ 30,493
Adjustments:
Earnings associated with unassigned capital 346 368 357
Consumer Special Assets activity 1,751 1,236 1,792
SFAS 133 transition adjustment net loss (106) ––
Gain on sale of a business –187 –
Other (119) (18) (121)
Consolidated revenue $ 34,981 $ 33,253 $ 32,521
Segments’ net income $7,148 $ 7,360 $ 7,251
Adjustments, net of taxes:
Earnings associated with unassigned capital 222 235 231
Consumer Special Assets activity 586 318 610
SFAS 133 transition adjustment net loss (68) ––
Gain on sale of a business –117 –
Provision for credit losses in excess of net charge-offs (182) (86) –
Gains on sales of securities 333 25 118
Severance charge (96) ––
Litigation expense (214) ––
Exit charges (1,250) ––
Merger and restructuring charges –(346) (358)
Tax benefit associated with basis difference in subsidiary stock 267 ––
Other 46 (106) 30
Consolidated net income $6,792 $ 7,517 $ 7,882
Segments’ total assets $532,060 $527,664
Adjustments:
Available-for-sale securities 70,540 47,256
Elimination of excess earning asset allocations (65,908) (52,826)
Consumer Special Assets 56,628 96,419
Other, net 28,444 23,678
Consolidated total assets $ 621,764 $ 642,191
The adjustments presented in the table above represent consolidated income, expense and asset balances not specifically allocated to individual
business segments. In addition, reconciling items also include the effect of earnings allocations not assigned to specific business segments, as well
as the related earning asset balances.