Bank of America 2001 Annual Report Download - page 73
Download and view the complete annual report
Please find page 73 of the 2001 Bank of America annual report below. You can navigate through the pages in the report by either clicking on the pages listed below, or by using the keyword search tool below to find specific information within the annual report.-
 1
1 -
2
-
3
-
4
-
5
-
6
-
7
-
8
-
9
-
10
-
11
-
12
-
13
-
14
-
15
-
16
-
17
-
18
-
19
-
20
-
21
-
22
-
23
-
24
-
25
-
26
-
27
-
28
-
29
-
30
-
31
-
32
-
33
-
34
-
35
-
36
-
37
-
38
-
39
-
40
-
41
-
42
-
43
-
44
-
45
-
46
-
47
-
48
-
49
-
50
-
51
-
52
-
53
-
54
-
55
-
56
-
57
-
58
-
59
-
60
-
61
-
62
-
 63
63 -
 64
64 -
 65
65 -
 66
66 -
 67
67 -
 68
68 -
 69
69 -
 70
70 -
 71
71 -
 72
72 -
 73
73 -
 74
74 -
 75
75 -
 76
76 -
 77
77 -
 78
78 -
 79
79 -
 80
80 -
 81
81 -
 82
82 -
 83
83 -
84
-
85
-
86
-
87
-
88
-
89
-
90
-
91
-
92
-
93
-
94
-
95
-
96
-
97
-
98
-
99
-
100
-
101
-
102
-
103
-
104
-
105
-
106
-
107
-
108
-
109
-
110
-
111
-
112
-
113
-
114
-
115
-
116
-
117
-
118
-
119
-
120
-
121
-
122
-
123
-
124
 |
 |

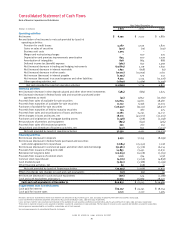
BANK OF AMERICA 2001 ANNUAL REPORT
71
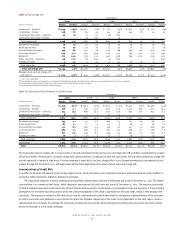
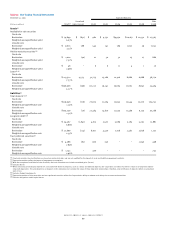
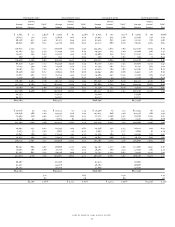
Table 25 Selected Quarterly Financial Data
2001 Quarters 2000 Quarters
(Dollars in millions, except per share information)
Fourth Third Second First Fourth Third Second First
As Reported
Income statement
Net interest income $5,417 $ 5,204 $ 5,030 $ 4,639 $ 4,664 $ 4,563 $ 4,617 $ 4,505
Noninterest income 3,398 3,429 3,741 3,780 3,328 3,675 3,514 4,065
Total revenue 8,815 8,633 8,771 8,419 7,992 8,238 8,131 8,570
Provision for credit losses 1,401 1,251 800 835 1,210 435 470 420
Gains (losses) on sales of securities 393 97 (7) (8) 2 11 6 6
Business exit costs –1,305––––––
Restructuring charges –––––550––
Other noninterest expense 5,324 4,606 4,821 4,654 4,637 4,410 4,413 4,623
Income before income taxes 2,483 1,568 3,143 2,922 2,147 2,854 3,254 3,533
Income tax expense 426 727 1,120 1,052 762 1,025 1,191 1,293
Net income 2,057 841 2,023 1,870 1,385 1,829 2,063 2,240
Performance ratios
Return on average assets 1.25% .52% 1.24% 1.17% .81% 1.06% 1.23% 1.38%
Return on average common
shareholders’ equity 16.70 6.78 16.67 15.86 11.57 15.25 17.63 19.59
Total equity to total assets (period-end) 7.80 7.83 7.88 8.02 7.42 6.98 6.75 6.90
Total average equity to total average assets 7.50 7.66 7.43 7.38 7.03 6.97 7.00 7.07
Dividend payout ratio 45.53 106.49 44.35 48.14 65.58 44.83 39.94 37.16
Per common share data
Earnings $1.31 $ .52 $ 1.26 $ 1.16 $ .85 $ 1.11 $ 1.25 $ 1.34
Diluted earnings 1.28 .51 1.24 1.15 .85 1.10 1.23 1.33
Cash dividends paid .60 .56 .56 .56 .56 .50 .50 .50
Book value 31.07 31.66 30.75 30.47 29.47 28.69 27.82 27.28
Cash basis financial data(1)
Earnings $2,270 $ 1,060 $ 2,246 $ 2,093 $ 1,599 $ 2,044 $ 2,281 $ 2,457
Earnings per common share 1.45 .66 1.40 1.30 .98 1.25 1.38 1.47
Diluted earnings per common share 1.42 .65 1.38 1.28 .98 1.23 1.36 1.46
Return on average assets 1.38% .65% 1.37% 1.31% .94% 1.18% 1.36% 1.52%
Return on average common
shareholders’ equity 18.43 8.55 18.52 17.75 13.36 17.01 19.49 21.49
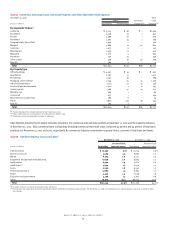
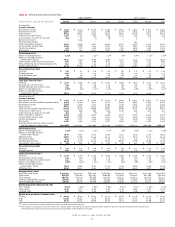
Operating Basis(2)
Income statement
Net interest income $5,417 $ 5,204 $ 5,030 $ 4,639 $ 4,664 $ 4,563 $ 4,617 $ 4,505
Net interest income (taxable-equivalent basis) 5,505 5,290 5,117 4,721 4,758 4,642 4,695 4,576
Noninterest income 3,398 3,429 3,741 3,780 3,328 3,675 3,514 4,065
Total revenue 8,815 8,633 8,771 8,419 7,992 8,238 8,131 8,570
Total revenue (taxable-equivalent basis) 8,903 8,719 8,858 8,501 8,086 8,317 8,209 8,641
Provision for credit losses 1,401 856 800 835 1,210 435 470 420
Gains (losses) on sales of securities 393 97 (7) (8) 2 11 6 6
Other noninterest expense 5,324 4,606 4,821 4,654 4,637 4,410 4,413 4,623
Income before income taxes 2,483 3,268 3,143 2,922 2,147 3,404 3,254 3,533
Income tax expense 426 1,177 1,120 1,052 762 1,229 1,191 1,293
Net income 2,057 2,091 2,023 1,870 1,385 2,175 2,063 2,240
Average diluted common shares issued
and outstanding (in thousands) 1,602,886 1,634,063 1,632,964 1,631,099 1,638,863 1,661,031 1,676,089 1,688,318
Performance ratios
Return on average assets 1.25% 1.29% 1.24% 1.17% .81% 1.26% 1.23% 1.38%
Return on average common
shareholders’ equity 16.70 16.87 16.67 15.86 11.57 18.15 17.63 19.59
Efficiency ratio 59.80 52.82 54.44 54.73 57.35 53.01 53.77 53.49
Net interest yield 3.95 3.78 3.61 3.39 3.21 3.10 3.23 3.26
Dividend payout ratio 45.53 42.79 44.35 48.14 65.58 37.68 39.94 37.16
Shareholder value added $793 $ 824 $ 791 $ 679 $ 164 $ 953 $ 878 $ 1,086
Per common share data
Earnings $1.31 $ 1.31 $ 1.26 $ 1.16 $ .85 $ 1.33 $ 1.25 $ 1.34
Diluted earnings 1.28 1.28 1.24 1.15 .85 1.31 1.23 1.33
Cash basis financial data(1)
Earnings $2,270 $ 2,310 $ 2,246 $ 2,093 $ 1,599 $ 2,390 $ 2,281 $ 2,457
Earnings per common share 1.45 1.44 1.40 1.30 .98 1.46 1.38 1.47
Diluted earnings per common share 1.42 1.41 1.38 1.28 .98 1.44 1.36 1.46
Return on average assets 1.38% 1.43% 1.37% 1.31% .94% 1.39% 1.36% 1.52%
Return on average common
shareholders’ equity 18.43 18.64 18.52 17.75 13.36 19.94 19.49 21.49
Efficiency ratio 57.40 50.32 51.92 52.11 54.70 50.43 51.12 50.98
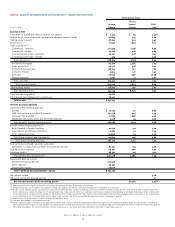
Average balance sheet
Total loans and leases $ 333,354 $357,726 $383,500 $387,889 $399,549 $402,763 $ 391,404 $376,584
Total assets 651,797 642,184 655,557 648,698 677,458 685,017 672,588 651,019
Total deposits 368,171 363,328 363,348 355,618 357,554 356,734 353,426 345,374
Common shareholders’ equity 48,850 49,134 48,640 47,794 47,565 47,660 47,036 45,953
Total shareholders’ equity 48,916 49,202 48,709 47,866 47,639 47,735 47,112 46,030
Risk-based capital ratios (period-end)
Tier 1 capital 8.30% 7.95% 7.90% 7.65% 7.50% 7.32% 7.40% 7.42%
Total capital 12.67 12.12 12.09 11.84 11.04 10.80 11.03 11.00
Leverage ratio 6.56 6.59 6.50 6.41 6.12 6.06 6.11 6.17
Market price per share of common stock
Closing $ 62.95 $ 58.40 $ 60.03 $ 54.75 $ 45.88 $ 52.38 $ 43.00 $ 52.44
High 64.99 65.54 62.18 55.94 54.75 57.63 61.00 55.19
Low 52.10 50.25 48.65 45.00 36.31 43.63 42.98 42.31
(1) Cash basis calculations exclude goodwill and other intangible amortization expense.
(2) Operating basis excludes provision for credit losses of $395 million and noninterest expense of $1,305 million related to the exit of certain consumer finance businesses in
the third quarter of 2001 and restructuring charges of $550 million in the third quarter of 2000.