Bank of America 2001 Annual Report Download - page 42
Download and view the complete annual report
Please find page 42 of the 2001 Bank of America annual report below. You can navigate through the pages in the report by either clicking on the pages listed below, or by using the keyword search tool below to find specific information within the annual report.-
 1
1 -
2
-
3
-
4
-
5
-
6
-
7
-
8
-
9
-
10
-
11
-
12
-
13
-
14
-
15
-
16
-
17
-
18
-
19
-
20
-
21
-
22
-
23
-
24
-
25
-
26
-
27
-
28
-
29
-
30
-
31
-
 32
32 -
 33
33 -
 34
34 -
 35
35 -
 36
36 -
 37
37 -
 38
38 -
 39
39 -
 40
40 -
 41
41 -
 42
42 -
 43
43 -
 44
44 -
 45
45 -
 46
46 -
 47
47 -
 48
48 -
 49
49 -
 50
50 -
 51
51 -
 52
52 -
53
-
54
-
55
-
56
-
57
-
58
-
59
-
60
-
61
-
62
-
63
-
64
-
65
-
66
-
67
-
68
-
69
-
70
-
71
-
72
-
73
-
74
-
75
-
76
-
77
-
78
-
79
-
80
-
81
-
82
-
83
-
84
-
85
-
86
-
87
-
88
-
89
-
90
-
91
-
92
-
93
-
94
-
95
-
96
-
97
-
98
-
99
-
100
-
101
-
102
-
103
-
104
-
105
-
106
-
107
-
108
-
109
-
110
-
111
-
112
-
113
-
114
-
115
-
116
-
117
-
118
-
119
-
120
-
121
-
122
-
123
-
124
 |
 |

BANK OF AMERICA 2001 ANNUAL REPORT
40
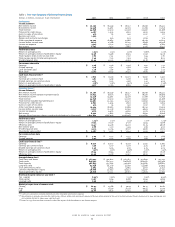
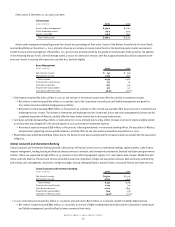
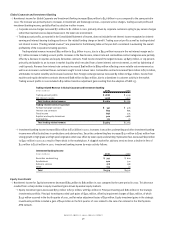
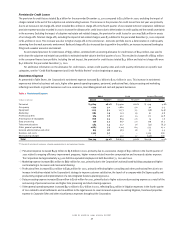
Client assets at December 31, 2001 and 2000 were:
Client Assets
(Dollars in billions)
2001 2000
Assets under management $314.2 $278.1
Client brokerage assets 99.4 99.5
Assets in custody 46.9 48.5
Total client assets $460.5 $426.1
Assets under management typically generate fees based on a percentage of their value. Assets of the Nations Funds family of mutual funds
reached $148 billion at December 31, 2001, primarily driven by an increase in money market funds in the declining equity market environment.
Growth in assets under management of $36 billion, or 13 percent, was primarily driven by the growth in money market funds as well as the addition
of the remaining Marsico Funds. Client brokerage assets, a source of commission revenue, were flat at approximately $100 billion compared to the
prior year. Assets in custody, which generate custodial fees, declined slightly.
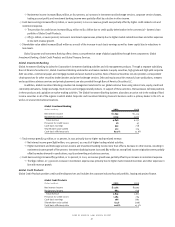
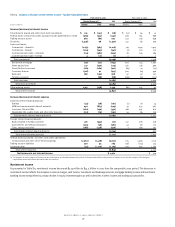
Asset Management
(Dollars in millions)
2001 2000
Net interest income $741 $ 666
Noninterest income 1,733 1,801
Total revenue 2,474 2,467
Provision for credit losses 121 47
Cash basis earnings 578 619
Shareholder value added 312 421
Cash basis efficiency ratio 59.9% 58.0%
>Total revenue remained flat at $2.5 billion in 2001, as the increase in net interest income was offset by a decline in noninterest income.
>
Net interest income increased $75 million, or 11 percent, due to the Corporation’s overall asset and liability management and growth in
the commercial and residential mortgage loan portfolios.
>
Noninterest income decreased $68 million, or four percent, as a decline in other income was partially offset by an increase in investment and
brokerage services income. The increase in investment and brokerage services income was due to new asset management business and the
completed acquisition of Marsico, partially offset by lower broker activity due to decreased trade volume.
>Cash basis earnings decreased $41 million, or seven percent, in 2001, primarily due to a $74 million increase in provision expense largely related
to one loan that was charged off in the second quarter of 2001 and increased noninterest expense.
>
Noninterest expense increased $78 million, or five percent, reflecting investments in new private banking offices, the acquisition of Marsico,
and personnel supporting revenue growth initiatives, partially offset by one-time business divestiture expenditures in 2000.
>Shareholder value added declined $109 million due to the decline in cash basis earnings and the increased capital associated with the acquisition
of Marsico.
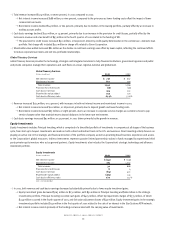
Global Corporate and Investment Banking
Global Corporate and Investment Banking provides a broad array of financial services such as investment banking, capital markets, trade finance,
treasury management, lending, leasing and financial advisory services to domestic and international corporations, financial institutions and government
entities. Clients are supported through offices in 34 countries in four distinct geographic regions: U.S. and Canada; Asia; Europe, Middle East and
Africa; and Latin America. Products and services provided include loan origination, merger and acquisition advisory, debt and equity underwriting
and trading, cash management, derivatives, foreign exchange, leasing, leveraged finance, project finance, structured finance and trade services.
Global Corporate and Investment Banking
(Dollars in millions)
2001 2000
Net interest income $4,592 $3,725
Noninterest income 4,639 4,444
Total revenue 9,231 8,169
Provision for credit losses 1,275 751
Cash basis earnings 2,022 1,897
Shareholder value added 644 336
Cash basis efficiency ratio 54.3% 57.4%
>In 2001, total revenue increased $1.1 billion, or 13 percent, primarily due to $620 million, or 22 percent, growth in trading-related revenue.
>
Net interest income increased $867 million, or 23 percent, as a result of higher trading-related activities and the Corporation’s overall asset
and liability management, partially offset by lower commercial loan levels.