Bank of America 2001 Annual Report Download - page 66
Download and view the complete annual report
Please find page 66 of the 2001 Bank of America annual report below. You can navigate through the pages in the report by either clicking on the pages listed below, or by using the keyword search tool below to find specific information within the annual report.-
 1
1 -
2
-
3
-
4
-
5
-
6
-
7
-
8
-
9
-
10
-
11
-
12
-
13
-
14
-
15
-
16
-
17
-
18
-
19
-
20
-
21
-
22
-
23
-
24
-
25
-
26
-
27
-
28
-
29
-
30
-
31
-
32
-
33
-
34
-
35
-
36
-
37
-
38
-
39
-
40
-
41
-
42
-
43
-
44
-
45
-
46
-
47
-
48
-
49
-
50
-
51
-
52
-
53
-
54
-
55
-
 56
56 -
 57
57 -
 58
58 -
 59
59 -
 60
60 -
 61
61 -
 62
62 -
 63
63 -
 64
64 -
 65
65 -
 66
66 -
 67
67 -
 68
68 -
 69
69 -
 70
70 -
 71
71 -
 72
72 -
 73
73 -
 74
74 -
 75
75 -
 76
76 -
77
-
78
-
79
-
80
-
81
-
82
-
83
-
84
-
85
-
86
-
87
-
88
-
89
-
90
-
91
-
92
-
93
-
94
-
95
-
96
-
97
-
98
-
99
-
100
-
101
-
102
-
103
-
104
-
105
-
106
-
107
-
108
-
109
-
110
-
111
-
112
-
113
-
114
-
115
-
116
-
117
-
118
-
119
-
120
-
121
-
122
-
123
-
124
 |
 |
BANK OF AMERICA 2001 ANNUAL REPORT
64
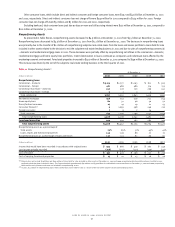
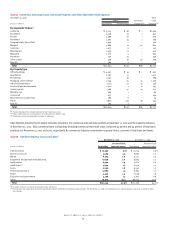
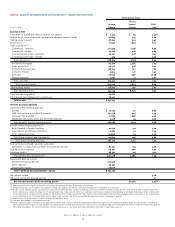
At December 31, 2001, the Corporation had cross border exposure in excess of one percent of total assets in the two countries detailed in Table Twenty.
The exposure in the United Kingdom and Germany reflects the Corporation’s efforts to diversify its portfolio in the industrialized countries where its
clients operate. In light of the increased risks perceived in Japan, the Corporation has reduced its exposure to less than 0.5 percent of its total assets.
Table 20 Exposure Exceeding One Percent of Total Assets(1,2)
Exposure
Public Private Total as a Percentage
(Dollars in millions)
December 31 Sector Banks Sector Exposure of Total Assets
United Kingdom 2001 $ 139 $2,807 $8,889 $11,835 1.90%
2000 355 1,962 6,167 8,484 1.32
Germany 2001 2,118 2,571 2,251 6,940 1.12
2000 2,188 2,249 2,062 6,499 1.01
Japan 2001 1,319 676 889 2,884 0.46
2000 4,925 599 883 6,407 1.00
(1) Exposure includes cross-border claims by the Corporation’s foreign offices as follows: loans, accrued interest receivable, acceptances, time deposits placed, trading account assets, available-
for-sale (at fair value) and held-to-maturity (at cost) securities, other interest-earning investments and other monetary assets. Amounts also include derivative-dealer assets, unused commit-
ments, standby letters of credit, commercial letters of credit and formal guarantees.
(2) Sector definitions are based on the FFIEC instructions for preparing the Country Exposure Report.
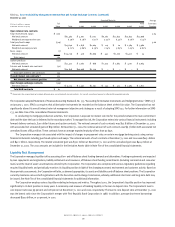
Market Risk Management
Overview
The Corporation is exposed to market risk as a consequence of the normal course of conducting its business activities. Examples of these business
activities include market making, underwriting, proprietary trading, and asset/liability management in interest rate, foreign exchange, equity, commodity
and credit markets, along with any associated derivative products. Market risk is the potential of loss arising from adverse changes in market rates,
prices and liquidity. Financial products that expose the Corporation to market risk include securities, loans, deposits, debt and derivative financial
instruments such as futures, forwards, swaps, options and other financial instruments with similar characteristics. Liquidity risk arises from the possibility
that the Corporation may not be able to satisfy current or future financial commitments or that the Corporation may be more reliant on alternative
funding sources such as long-term debt.
Trading Portfolio
The Board delegates responsibility for the day-to-day management of market risk to the Finance Committee. The Finance Committee has structured
a system of independent checks, balances and reporting in order to ensure that the Board’s disposition toward market risk is not compromised.
The objective of the Corporation’s Risk Management group (Risk Management) is to provide senior management with independent, timely
assessments of the bottom line impacts of all market risks facing the Corporation and to monitor those impacts against trading limits. Risk Management
monitors the changing aggregate position of the Corporation and projects the profit and loss levels that would result from both normal and extreme
market moves. In addition, Risk Management is responsible for ensuring that appropriate policies and procedures that conform to the Board’s risk
preferences are in place and enforced. These policies and procedures encompass the limit process, risk reporting, new product review and model review.
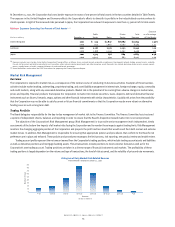
Trading account profits represent the net amount earned from the Corporation’s trading positions, which include trading account assets and liabilities
as well as derivative positions and mortgage banking assets. These transactions include positions to meet customer demand as well as for the
Corporation’s own trading account. Trading positions are taken in a diverse range of financial instruments and markets. The profitability of these
trading positions is largely dependent on the volume and type of transactions, the level of risk assumed, and the volatility of price and rate movements.
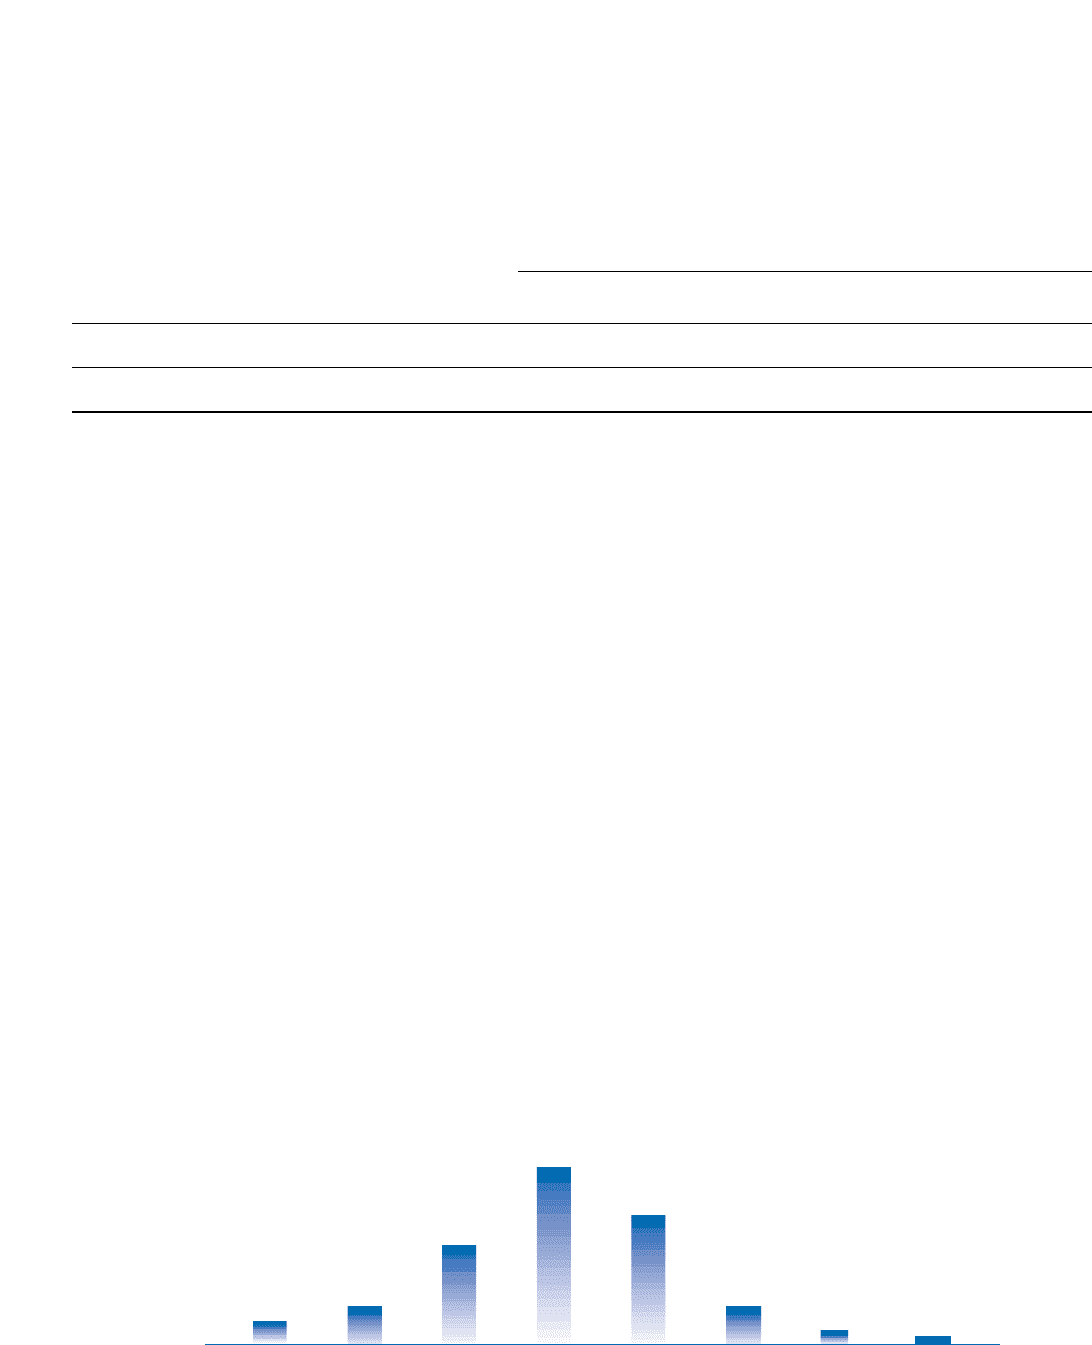
Revenue
Number of Days
(Dollars in millions)
Histogram of Daily Market Risk-Related Revenue
Twelve Months Ended December 31, 2001
<-10 -10 to 0 0 to 10 10 to 20 20 to 30 30 to 40 40 to 50 >50
0
30
60
90
80
70
50
40
20
10