Bank of America 2001 Annual Report Download - page 50
Download and view the complete annual report
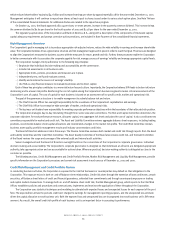
Please find page 50 of the 2001 Bank of America annual report below. You can navigate through the pages in the report by either clicking on the pages listed below, or by using the keyword search tool below to find specific information within the annual report.-
 1
1 -
2
-
3
-
4
-
5
-
6
-
7
-
8
-
9
-
10
-
11
-
12
-
13
-
14
-
15
-
16
-
17
-
18
-
19
-
20
-
21
-
22
-
23
-
24
-
25
-
26
-
27
-
28
-
29
-
30
-
31
-
32
-
33
-
34
-
35
-
36
-
37
-
38
-
39
-
 40
40 -
 41
41 -
 42
42 -
 43
43 -
 44
44 -
 45
45 -
 46
46 -
 47
47 -
 48
48 -
 49
49 -
 50
50 -
 51
51 -
 52
52 -
 53
53 -
 54
54 -
 55
55 -
 56
56 -
 57
57 -
 58
58 -
 59
59 -
 60
60 -
61
-
62
-
63
-
64
-
65
-
66
-
67
-
68
-
69
-
70
-
71
-
72
-
73
-
74
-
75
-
76
-
77
-
78
-
79
-
80
-
81
-
82
-
83
-
84
-
85
-
86
-
87
-
88
-
89
-
90
-
91
-
92
-
93
-
94
-
95
-
96
-
97
-
98
-
99
-
100
-
101
-
102
-
103
-
104
-
105
-
106
-
107
-
108
-
109
-
110
-
111
-
112
-
113
-
114
-
115
-
116
-
117
-
118
-
119
-
120
-
121
-
122
-
123
-
124
 |
 |

BANK OF AMERICA 2001 ANNUAL REPORT
48
Global Corporate and Investment Banking
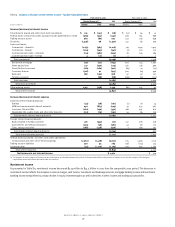
>Noninterest income for Global Corporate and Investment Banking increased $195 million to $4.6 billion in 2001 compared to the same period in
2000. The increase was primarily due to increases in investment and brokerage services, corporate service charges, trading account profits and
investment banking income, partially offset by a decline in other income.
>
Corporate service charges increased $72 million to $1.1 billion in 2001, primarily driven by corporate customers opting to pay service charges
rather than maintain excess deposit balances in the lower rate environment.
>
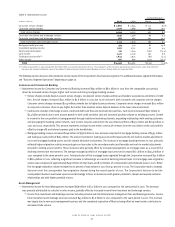
Trading account profits, as reported in the Consolidated Statement of Income, does not include the net interest income recognized on interest-
earning and interest-bearing trading positions or the related funding charge or benefit. Trading account profits as well as trading-related
net interest income (“trading-related revenue”) are presented in the following table as they are both considered in evaluating the overall
profitability of the Corporation’s trading positions.
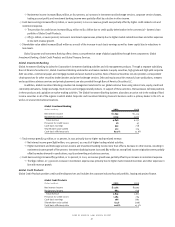
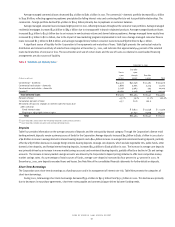
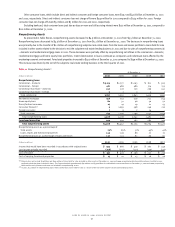
Trading-related revenue increased $620 million to $3.4 billion in 2001, due to a $543 million increase in the net interest margin and a
$77 million increase in trading account profits. Increases in the fixed income, interest rate and commodities contract categories were partially
offset by a decrease in equities and equity derivatives contracts. Fixed income showed the largest increase, up $483 million, or 129 percent,
primarily attributable to an increase in market liquidity which resulted from a lower interest rate environment, as well as tightening of
credit spreads. Revenue from interest rate contracts increased $198 million to $893 million reflecting a more volatile rate environment as
well as an increase in customer flow as customers sought to lock in lower rates. Commodities contracts increased $102 million to $172 million,
attributable to market volatility and increased customer flow. Foreign exchange revenue increased $5 million to $541 million. Income from
equities and equity derivatives contracts decreased $168 million to $920 million, due to a slowdown in customer activity in the market.
Trading account profits in 2001 included a $19 million transition adjustment gain resulting from the adoption of SFAS 133.
Trading-related Revenue in Global Corporate and Investment Banking
(Dollars in millions)
2001 2000
Trading account profits $1,818 $ 1,741
Net interest income 1,566 1,023
Total trading-related revenue $3,384 $2,764
Trading-related revenue by product
Foreign exchange contracts $ 541 $536
Interest rate contracts 893 695
Fixed income 858 375
Equities and equity derivatives 920 1,088
Commodities 172 70
Total trading-related revenue $3,384 $2,764
>
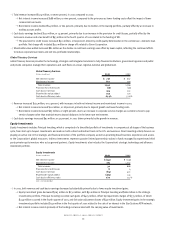
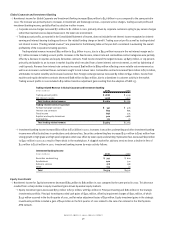
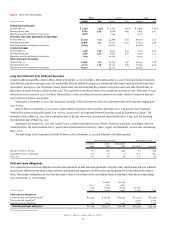
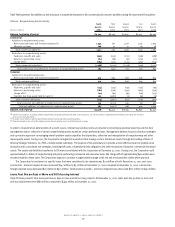
Investment banking income increased $67 million to $1.6 billion in 2001. Increases in securities underwriting and other investment banking
income were offset by declines in syndications and advisory fees. Securities underwriting fees increased $177 million to $797 million from
strong growth in high grade and high yield origination which was offset by lower equity underwriting. Syndication fees decreased $119 million
to $402 million in 2001 as a result of fewer deals in the marketplace. A sluggish market for advisory services drove a decline in fees of
$22 million to $276 million in 2001. Investment banking income by major activity follows:
Investment Banking Income
(Dollars in millions)
2001 2000
Securities underwriting $797 $ 620
Syndications 402 521
Advisory services 276 298
Other 104 73
Total $ 1,579 $1,512
Equity Investments
>Noninterest income for Equity Investments decreased $824 million to $183 million in 2001 compared to the same period in 2000. This decrease
resulted from a sharp decline in equity investment gains driven by weaker equity markets.
>
Equity investment gains decreased $763 million to $230 million, with $50 million in Principal Investing and $180 million in the strategic
investments portfolio. Principal Investing recorded cash gains of $425 million, offset by impairment charges of $335 million, of which
$245 million occurred in the fourth quarter of 2001, and fair value adjustment losses of $40 million. Equity investment gains in the strategic
investments portfolio included a gain of $140 million in the first quarter of 2001 related to the sale of an interest in the Star Systems
ATM network.