Bank of America 2001 Annual Report Download - page 59
Download and view the complete annual report
Please find page 59 of the 2001 Bank of America annual report below. You can navigate through the pages in the report by either clicking on the pages listed below, or by using the keyword search tool below to find specific information within the annual report.-
 1
1 -
2
-
3
-
4
-
5
-
6
-
7
-
8
-
9
-
10
-
11
-
12
-
13
-
14
-
15
-
16
-
17
-
18
-
19
-
20
-
21
-
22
-
23
-
24
-
25
-
26
-
27
-
28
-
29
-
30
-
31
-
32
-
33
-
34
-
35
-
36
-
37
-
38
-
39
-
40
-
41
-
42
-
43
-
44
-
45
-
46
-
47
-
48
-
 49
49 -
 50
50 -
 51
51 -
 52
52 -
 53
53 -
 54
54 -
 55
55 -
 56
56 -
 57
57 -
 58
58 -
 59
59 -
 60
60 -
 61
61 -
 62
62 -
 63
63 -
 64
64 -
 65
65 -
 66
66 -
 67
67 -
 68
68 -
 69
69 -
70
-
71
-
72
-
73
-
74
-
75
-
76
-
77
-
78
-
79
-
80
-
81
-
82
-
83
-
84
-
85
-
86
-
87
-
88
-
89
-
90
-
91
-
92
-
93
-
94
-
95
-
96
-
97
-
98
-
99
-
100
-
101
-
102
-
103
-
104
-
105
-
106
-
107
-
108
-
109
-
110
-
111
-
112
-
113
-
114
-
115
-
116
-
117
-
118
-
119
-
120
-
121
-
122
-
123
-
124
 |
 |

BANK OF AMERICA 2001 ANNUAL REPORT
57
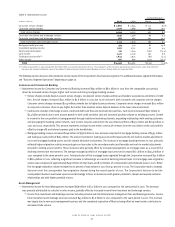
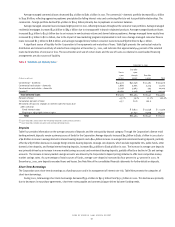
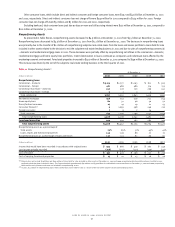
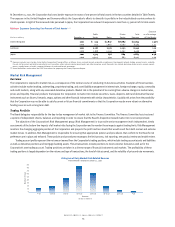
Other consumer loans, which include direct and indirect consumer and foreign consumer loans, were $39.7 and $42.8 billion at December 31, 2001
and 2000, respectively. Direct and indirect consumer loan net charge-offs were $349 million for 2001 compared to $324 million for 2000. Foreign
consumer loan net charge-offs were $5 million and $3 million for 2001 and 2000, respectively.
Excluding bankcard, total consumer loans past due 90 days or more and still accruing interest were $127 million at December 31, 2001, compared to
$110 million at December 31, 2000.
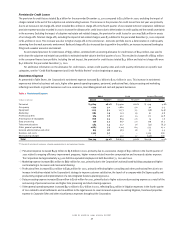
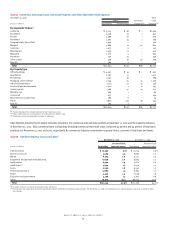
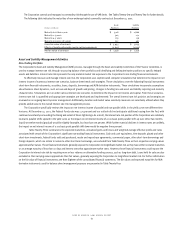
Nonperforming Assets
As presented in Table Eleven, nonperforming assets decreased to $4.9 billion at December 31, 2001 from $5.5 billion at December 31, 2000.
Nonperforming loans decreased to $4.5 billion at December 31, 2001 from $5.2 billion at December 31, 2000. The decrease in nonperforming loans
was primarily due to the transfer of $1.2 billion of nonperforming subprime real estate loans from the loans and leases portfolio to loans held for sale
included in other assets related to the decision to exit the subprime real estate lending business in 2001 and due to sales of nonperforming commercial
– domestic and residential mortgage loans in 2001. These decreases were partially offset by nonperforming net inflows in the commercial – domestic,
residential mortgage and home equity lines portfolios. Credit deterioration in loans continued as companies and individuals were affected by the
weakening economic environment. Foreclosed properties increased to $402 million at December 31, 2001 compared to $249 million at December 31, 2000.
This increase was driven by the exit of the subprime real estate lending business in the third quarter of 2001.
Table 11 Nonperforming Assets(1)
At December 31
(Dollars in millions)
2001 2000 1999 1998 1997
Nonperforming loans
Commercial – domestic $3,123 $2,777 $ 1,163 $ 812 $ 563
Commercial – foreign 461 486 486 314 155
Commercial real estate – domestic 240 236 191 299 342
Commercial real estate – foreign 33342
Total commercial 3,827 3,502 1,843 1,429 1,062
Residential mortgage 556 551 529 722 744
Home equity lines 80 32465052
Direct/Indirect consumer 27 19 19 21 43
Consumer finance(2) 91,095 598 246 210
Foreign consumer 79714–
Total consumer 679 1,706 1,199 1,053 1,049
Total nonperforming loans 4,506 5,208 3,042 2,482 2,111
Foreclosed properties 402 249 163 282 309
Total nonperforming assets $4,908 $5,457 $3,205 $2,764 $2,420
Nonperforming assets as a percentage of:
Total assets .79% .85% .51% .45% .42%
Loans, leases and foreclosed properties 1.49 1.39 .86 .77 .71
Nonperforming loans as a percentage of loans and leases 1.37 1.33 .82 .69 .62
(Dollars in millions)
2001 2000 1999 1998 1997
Income that would have been recorded in accordance with original terms $593 $ 666 $ 419 $ 367 $ 349
Less income actually recorded (256) (237) (123) (130) (130)
Loss of income $337 $ 429 $ 296 $ 237 $ 219
Cost of carrying foreclosed properties $15 $12 $13 $16 $26
(1) Balance does not include $1.0 billion and $124 million of loans held for sale, included in other assets at December 31, 2001 and 2000, respectively, which would have been classified as non-
performing had they been included in loans. The Corporation had approximately $48 million and $390 million of troubled debt restructured loans at December 31, 2001 and 2000, respectively,
which were accruing interest and were not included in nonperforming assets.
(2) In 2001, $1.2 billion of nonperforming loans were transferred to loans held for sale as a result of the exit of the subprime real estate lending business.