Bank of America 2001 Annual Report Download - page 44
Download and view the complete annual report
Please find page 44 of the 2001 Bank of America annual report below. You can navigate through the pages in the report by either clicking on the pages listed below, or by using the keyword search tool below to find specific information within the annual report.-
 1
1 -
2
-
3
-
4
-
5
-
6
-
7
-
8
-
9
-
10
-
11
-
12
-
13
-
14
-
15
-
16
-
17
-
18
-
19
-
20
-
21
-
22
-
23
-
24
-
25
-
26
-
27
-
28
-
29
-
30
-
31
-
32
-
33
-
 34
34 -
 35
35 -
 36
36 -
 37
37 -
 38
38 -
 39
39 -
 40
40 -
 41
41 -
 42
42 -
 43
43 -
 44
44 -
 45
45 -
 46
46 -
 47
47 -
 48
48 -
 49
49 -
 50
50 -
 51
51 -
 52
52 -
 53
53 -
 54
54 -
55
-
56
-
57
-
58
-
59
-
60
-
61
-
62
-
63
-
64
-
65
-
66
-
67
-
68
-
69
-
70
-
71
-
72
-
73
-
74
-
75
-
76
-
77
-
78
-
79
-
80
-
81
-
82
-
83
-
84
-
85
-
86
-
87
-
88
-
89
-
90
-
91
-
92
-
93
-
94
-
95
-
96
-
97
-
98
-
99
-
100
-
101
-
102
-
103
-
104
-
105
-
106
-
107
-
108
-
109
-
110
-
111
-
112
-
113
-
114
-
115
-
116
-
117
-
118
-
119
-
120
-
121
-
122
-
123
-
124
 |
 |

BANK OF AMERICA 2001 ANNUAL REPORT
42
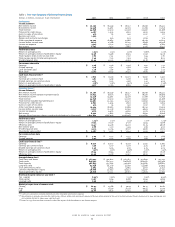
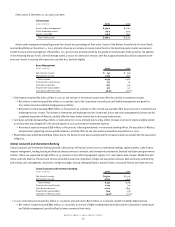
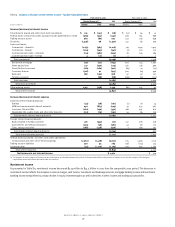
>Total revenue increased $174 million, or seven percent, in 2001 compared to 2000.
>
Net interest income increased $188 million, or nine percent, compared to the prior year as lower funding costs offset the impact of lower
commercial loan levels.
>
Noninterest income declined $14 million, or two percent, primarily due to declines in the leasing portfolio, partially offset by an increase in
trading account profits.
>Cash basis earnings declined $121 million, or 14 percent, primarily due to an increase in the provision for credit losses, partially offset by the
increase in revenue and a tax benefit of $93 million in the fourth quarter of 2001 related to the funding of SSI.
>
The provision for credit losses increased $501 million, or 66 percent, driven by credit quality deterioration in the commercial – domestic loan
portfolio. Net charge-offs included $210 million in charge-offs related to Enron Corporation.
>Shareholder value added increased $81 million as the decline in cash basis earnings was offset by lower capital, reflecting the continued efforts
to reduce corporate loan levels and exit less profitable relationships.
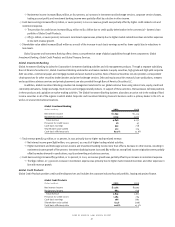
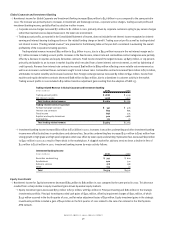
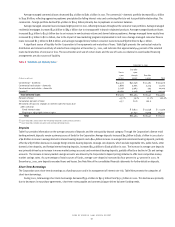
Global Treasury Services
Global Treasury Services provides the technology, strategies and integrated solutions to help financial institutions, government agencies and public
and private companies manage their operations and cash flows on a local, regional, national and global level.
Global Treasury Services
(Dollars in millions)
2001 2000
Net interest income $718 $ 607
Noninterest income 822 759
Total revenue 1,540 1,366
Provision for credit losses (16) (56)
Cash basis earnings 324 232
Shareholder value added 259 170
Cash basis efficiency ratio 67.4% 77.6%
>Revenue increased $174 million, or 13 percent, with increases in both net interest income and noninterest income in 2001.
>
Net interest income increased $111 million, or 18 percent, primarily due to deposit growth and lower funding costs.
>
Noninterest income increased $63 million, or eight percent, due to an increase in corporate service charges as customers chose to pay
service charges rather than maintain excess deposit balances in the lower rate environment.
>Cash basis earnings increased $92 million, or 40 percent, in 2001 driven primarily by the growth in revenue.
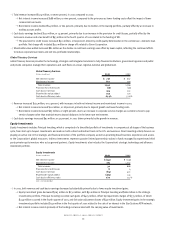
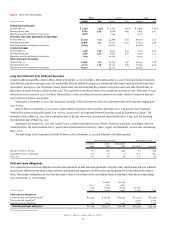
Equity Investments
Equity Investments includes Principal Investing, which is comprised of a diversified portfolio of investments in companies at all stages of the business
cycle, from start up to buyout. Investments are made on both a direct and indirect basis in the U.S. and overseas. Direct investing activity focuses on
playing an active role in the strategic and financial direction of the portfolio company as well as providing broad business experience and access
to the Corporation’s global resources. Indirect investments represent passive limited partnership stakes in funds managed by experienced third
party private equity investors who act as general partners. Equity Investments also includes the Corporation’s strategic technology and alliances
investment portfolio.
Equity Investments
(Dollars in millions)
2001 2000
Net interest income $ (151) $(139)
Noninterest income 183 1,007
Total revenue 32 868
Provision for credit losses 84
Cash basis earnings (84) 472
Shareholder value added (363) 241
Cash basis efficiency ratio n/m 11.7%
n/m = not meaningful
>In 2001, both revenue and cash basis earnings decreased substantially primarily due to lower equity investment gains.
>
Equity investment gains decreased $763 million to $230 million, with $50 million in Principal Investing and $180 million in the strategic
investments portfolio. Principal Investing recorded cash gains of $425 million, offset by impairment charges of $335 million, of which
$245 million occurred in the fourth quarter of 2001, and fair value adjustment losses of $40 million. Equity investment gains in the strategic
investments portfolio included $140 million in the first quarter of 2001 related to the sale of an interest in the Star Systems ATM network.
>
Net interest income consists primarily of the funding cost associated with the carrying value of investments.