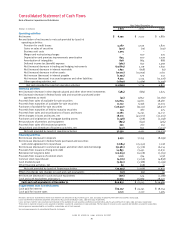
Bank of America 2001 Annual Report Download - page 92
Download and view the complete annual report
Please find page 92 of the 2001 Bank of America annual report below. You can navigate through the pages in the report by either clicking on the pages listed below, or by using the keyword search tool below to find specific information within the annual report.-
 1
1 -
2
-
3
-
4
-
5
-
6
-
7
-
8
-
9
-
10
-
11
-
12
-
13
-
14
-
15
-
16
-
17
-
18
-
19
-
20
-
21
-
22
-
23
-
24
-
25
-
26
-
27
-
28
-
29
-
30
-
31
-
32
-
33
-
34
-
35
-
36
-
37
-
38
-
39
-
40
-
41
-
42
-
43
-
44
-
45
-
46
-
47
-
48
-
49
-
50
-
51
-
52
-
53
-
54
-
55
-
56
-
57
-
58
-
59
-
60
-
61
-
62
-
63
-
64
-
65
-
66
-
67
-
68
-
69
-
70
-
71
-
72
-
73
-
74
-
75
-
76
-
77
-
78
-
79
-
80
-
81
-
 82
82 -
 83
83 -
 84
84 -
 85
85 -
 86
86 -
 87
87 -
 88
88 -
 89
89 -
 90
90 -
 91
91 -
 92
92 -
 93
93 -
 94
94 -
 95
95 -
 96
96 -
 97
97 -
 98
98 -
 99
99 -
 100
100 -
 101
101 -
 102
102 -
103
-
104
-
105
-
106
-
107
-
108
-
109
-
110
-
111
-
112
-
113
-
114
-
115
-
116
-
117
-
118
-
119
-
120
-
121
-
122
-
123
-
124
 |
 |

BANK OF AMERICA 2001 ANNUAL REPORT
90
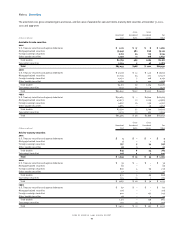
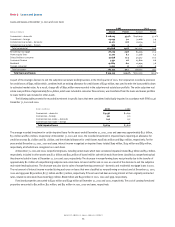
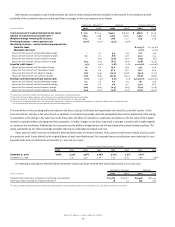
The expected maturity distribution and yields (computed on a taxable-equivalent basis) of the Corporation’s securities portfolio at December 31, 2001
are summarized below. Actual maturities may differ from contractual maturities or expected maturities shown below since borrowers may have the
right to prepay obligations with or without prepayment penalties.
Due after 1Due after 5
Due in 1year year through years through Due after
or less 5years 10 years 10 years Total
(Dollars in millions)
Amount Yield Amount Yield Amount Yield Amount Yield Amount Yield
Fair value of available-for-sale securities
U.S. Treasury securities
and agency debentures $ 40 5.36% $ 496 5.34% $ 21 5.90% $ 723 6.20% $ 1,280 5.83%
Mortgage-backed securities 274 6.59 44,668 5.93 26,058 5.32 2,101 6.38 73,101 5.73
Foreign sovereign securities 1,104 2.51 132 4.91 212 3.84 1,696 5.70 3,144 4.42
Other taxable securities 61 6.35 2,945 4.86 63 5.75 1,573 6.30 4,642 5.38
Total taxable 1,479 3.50 48,241 5.86 26,354 5.31 6,093 6.15 82,167 5.66
Tax-exempt securities 46 7.40 65 7.88 600 6.80 1,572 7.38 2,283 7.24
Total $1,525 3.62% $48,306 5.86% $26,954 5.34% $7,665 6.40% $84,450 5.70%
Amortized cost of available-
for-sale securities $ 1,512 $48,627 $ 27,177 $7,777 $85,093
Amortized cost of held-to-maturity securities
U.S. Treasury securities
and agency debentures $ – –% $ 5 4.22% $ – –% $ – –% $ 5 0.84%
Mortgage-backed securities 1 2.36 4 2.37 – – – – 5 2.37
Foreign sovereign securities 5 4.96 18 4.87 11 4.91 763 7.17 797 7.08
Other taxable securities – – – – – – 26 6.38 26 6.38
Total taxable 6 4.53 27 4.38 11 4.91 789 7.15 833 7.01
Tax-exempt securities 21 9.27 89 10.02 59 8.31 47 6.48 216 8.71
Total $ 27 8.22% $ 116 8.71% $ 70 7.78% $ 836 7.11% $ 1,049 7.34%
Fair value of held-to-maturity securities $ 27 $ 119 $ 74 $ 789 $ 1,009
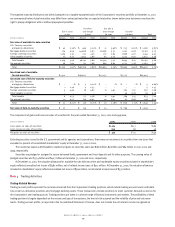
The components of gains and losses on sales of securities for the years ended December 31, 2001, 2000 and 1999 were:
(Dollars in millions)
2001 2000 1999
Gross gains on sales of securities $1,074 $123 $289
Gross losses on sales of securities 599 98 49
Net gains on sales of securities $475 $ 25 $240
Excluding securities issued by the U.S. government and its agencies and corporations, there were no investments in securities from one issuer that
exceeded 10 percent of consolidated shareholders’ equity at December 31, 2001 or 2000.
The income tax expense attributable to realized net gains on securities sales was $166 million, $9 million and $84 million in 2001, 2000 and
1999, respectively.
Securities are pledged or assigned to secure borrowed funds, government and trust deposits and for other purposes. The carrying value of
pledged securities was $37.4 billion and $40.7 billion at December 31, 2001 and 2000, respectively.
At December 31, 2001, the valuation allowance for available-for-sale debt securities and marketable equity securities included in shareholders’
equity reflected unrealized net losses of $480 million, net of related income taxes of $311 million. At December 31, 2000, the valuation allowance
included in shareholders’ equity reflected unrealized net losses of $560 million, net of related income taxes of $330 million.
Note 4 Trading Activities
Trading-Related Revenue
Trading account profits represent the net amount earned from the Corporation’s trading positions, which include trading account assets and liabili-
ties as well as derivative positions and mortgage banking assets. These transactions include positions to meet customer demand as well as for
the Corporation’s own trading account. Trading positions are taken in a diverse range of financial instruments and markets. The profitability of these
trading positions is largely dependent on the volume and type of transactions, the level of risk assumed and the volatility of price and rate move-
ments. Trading account profits, as reported in the Consolidated Statement of Income, does not include the net interest income recognized on