Bank of America 2001 Annual Report Download - page 55
Download and view the complete annual report
Please find page 55 of the 2001 Bank of America annual report below. You can navigate through the pages in the report by either clicking on the pages listed below, or by using the keyword search tool below to find specific information within the annual report.-
 1
1 -
2
-
3
-
4
-
5
-
6
-
7
-
8
-
9
-
10
-
11
-
12
-
13
-
14
-
15
-
16
-
17
-
18
-
19
-
20
-
21
-
22
-
23
-
24
-
25
-
26
-
27
-
28
-
29
-
30
-
31
-
32
-
33
-
34
-
35
-
36
-
37
-
38
-
39
-
40
-
41
-
42
-
43
-
44
-
 45
45 -
 46
46 -
 47
47 -
 48
48 -
 49
49 -
 50
50 -
 51
51 -
 52
52 -
 53
53 -
 54
54 -
 55
55 -
 56
56 -
 57
57 -
 58
58 -
 59
59 -
 60
60 -
 61
61 -
 62
62 -
 63
63 -
 64
64 -
 65
65 -
66
-
67
-
68
-
69
-
70
-
71
-
72
-
73
-
74
-
75
-
76
-
77
-
78
-
79
-
80
-
81
-
82
-
83
-
84
-
85
-
86
-
87
-
88
-
89
-
90
-
91
-
92
-
93
-
94
-
95
-
96
-
97
-
98
-
99
-
100
-
101
-
102
-
103
-
104
-
105
-
106
-
107
-
108
-
109
-
110
-
111
-
112
-
113
-
114
-
115
-
116
-
117
-
118
-
119
-
120
-
121
-
122
-
123
-
124
 |
 |

BANK OF AMERICA 2001 ANNUAL REPORT
53
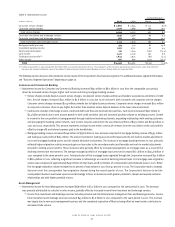
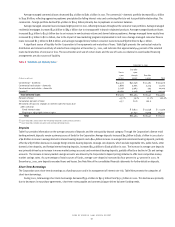
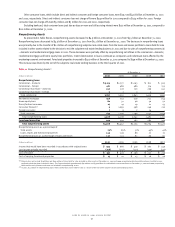
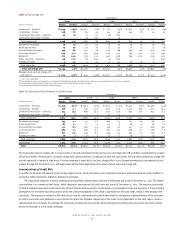
Credit Extension Commitments
Many of the Corporation’s lending relationships, including those with commercial and consumer customers, contain both funded and unfunded elements.
The unfunded component of these commitments is not recorded on the Corporation’s balance sheet. These commitments are more fully discussed
in Note Twelve of the consolidated financial statements. The table below summarizes the total unfunded credit extension, or off-balance sheet,
commitment amounts by expiration date.
Expires after Expires after
Expires in 1 year 3 years
1 year through through Expires after
(Dollars in millions)
or less 3 years 5 years 5 years Total
Credit extension commitments
Credit card commitments $ 73,644 $ – $ – $ – $ 73,644
Other loan commitments(1) 97,570 50,891 37,359 35,709 221,529
Standby letters of credit and financial guarantees 28,268 8,790 829 2,487 40,374
Commercial letters of credit 3,243 518 49 147 3,957
Total credit extension commitments $202,725 $ 60,199 $ 38,237 $ 38,343 $339,504
(1) Other loan commitments include equity commitments of approximately $2.7 billion primarily related to obligations to fund existing venture capital equity investments.
Off-Balance Sheet Financing Entity Commitments
In the normal course of business, the Corporation also supports its customers’ financing needs through facilitating their access to the commercial
paper markets. These markets provide an attractive, lower cost financing alternative for the Corporation’s customers. These customers sell assets,
such as high-grade trade or other receivables or leases, to a commercial paper financing entity, which in turn issues high-grade short-term commercial
paper that is collateralized by such assets. The Corporation facilitates these transactions and bills and collects fees from the financing entity for the
services it provides including administration, trust services and marketing the commercial paper. In addition, the Corporation receives fees for
providing liquidity and standby letters of credit or similar loss protection commitments to the financing entities. The Corporation manages its credit
risk on these commitments by subjecting them to normal underwriting and risk management processes. At December 31, 2001 and 2000, the
Corporation had off-balance sheet liquidity commitments and standby letters of credit and other financial guarantees to these financing entities of
$36.1 billion and $27.6 billion, respectively. Substantially all of these liquidity commitments and standby letters of credit and other financial guarantees
mature within one year. These amounts are included in total credit extension commitments in the table above. Net revenues earned from fees associated
with these financing entities were approximately $256 million and $212 million in 2001 and 2000, respectively.
In addition, to preserve its own liquidity and control its capital position, the Corporation from time to time will seek alternative funding sources.
To accomplish this, the Corporation will sell or fund assets using an off-balance sheet financing entity, which in turn, issues collateralized commercial paper
or structured notes to third-party market participants. The Corporation may provide liquidity and standby letters of credit or similar loss protection
commitments to the financing entity, or it may enter into a derivative with the entity whereby the Corporation assumes certain market risk. Similar to
that discussed above, the Corporation receives fees for the services it provides to the financing entity, and it manages any market risk on commitments or
derivatives through normal underwriting and risk management processes. Derivative activity related to these financing entities is included in Note Five of
the consolidated financial statements. At December 31, 2001 and 2000, the Corporation had off-balance sheet liquidity commitments and standby letters of
credit and other financial guarantees to these financing entities of $4.3 billion and $3.2 billion, respectively. Substantially all of these liquidity commitments
and standby letters of credit and other financial guarantees mature within one year. These amounts are included in total credit extension commitments in
the table above. Net revenues earned from fees associated with these financing entities were $49 million and $51 million in 2001 and 2000, respectively.
Because the Corporation provides liquidity and credit support to these financing entities, the Corporation’s credit ratings and changes thereto will
affect the borrowing cost and liquidity of these entities. In addition, significant changes in counterparty asset valuation and credit standing may also affect
the liquidity of the commercial paper issuance. Further, disruption in the commercial paper markets may result in the Corporation having to fund under
these commitments and letters of credit discussed above. These risks, along with all other credit and liquidity risks, are managed by the Corporation within
its policies and practices. See Note One of the consolidated financial statements for an additional discussion of off-balance sheet financing entities.
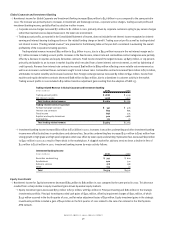
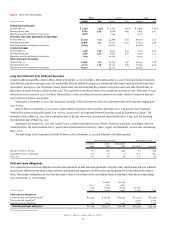
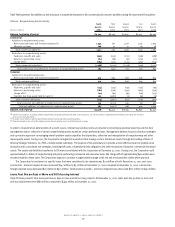
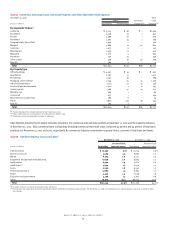
Capital Resources and Capital Management
Shareholders’ equity at December 31, 2001 was $48.5 billion compared to $47.6 billion at December 31, 2000, an increase of $892 million. The increase
was primarily due to $3.2 billion of net earnings (net income less dividends), $1.1 billion of net gains on derivatives and $1.1 billion in common stock
issued under employee plans, partially offset by the repurchase of common stock for approximately $4.7 billion. The Tier 1 Capital Ratio rose 80 basis
points from December 31, 2000 to 8.30 percent. At December 31, 2001, the Corporation was classified as well-capitalized.
On December 11, 2001, the Corporation’s Board of Directors (the Board) authorized a new stock repurchase program of up to 130 million shares of the
Corporation’s common stock at an aggregate cost of up to $10.0 billion. No shares had been repurchased under the 2001 program at December 31, 2001.
The remaining buyback authority for common stock under the 2000 repurchase program totaled $2.1 billion, or two million shares. During 2001, the
Corporation repurchased approximately 82 million shares of its common stock in open market repurchases at an average per-share price of $57.58,