Bank of America 2001 Annual Report Download - page 82
Download and view the complete annual report
Please find page 82 of the 2001 Bank of America annual report below. You can navigate through the pages in the report by either clicking on the pages listed below, or by using the keyword search tool below to find specific information within the annual report.-
 1
1 -
2
-
3
-
4
-
5
-
6
-
7
-
8
-
9
-
10
-
11
-
12
-
13
-
14
-
15
-
16
-
17
-
18
-
19
-
20
-
21
-
22
-
23
-
24
-
25
-
26
-
27
-
28
-
29
-
30
-
31
-
32
-
33
-
34
-
35
-
36
-
37
-
38
-
39
-
40
-
41
-
42
-
43
-
44
-
45
-
46
-
47
-
48
-
49
-
50
-
51
-
52
-
53
-
54
-
55
-
56
-
57
-
58
-
59
-
60
-
61
-
62
-
63
-
64
-
65
-
66
-
67
-
68
-
69
-
70
-
71
-
 72
72 -
 73
73 -
 74
74 -
 75
75 -
 76
76 -
 77
77 -
 78
78 -
 79
79 -
 80
80 -
 81
81 -
 82
82 -
 83
83 -
 84
84 -
 85
85 -
 86
86 -
 87
87 -
 88
88 -
 89
89 -
 90
90 -
 91
91 -
 92
92 -
93
-
94
-
95
-
96
-
97
-
98
-
99
-
100
-
101
-
102
-
103
-
104
-
105
-
106
-
107
-
108
-
109
-
110
-
111
-
112
-
113
-
114
-
115
-
116
-
117
-
118
-
119
-
120
-
121
-
122
-
123
-
124
 |
 |

BANK OF AMERICA 2001 ANNUAL REPORT
80
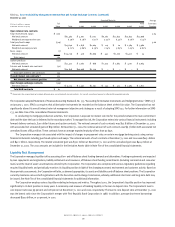
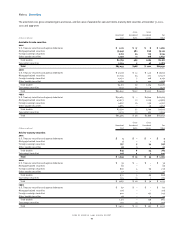
Consolidated Statement of Changes in Shareholders’ Equity
Bank of America Corporation and Subsidiaries
Accumulated Total
Other Share-
Preferred Common Stock Retained Comprehensive holders’ Comprehensive
(Dollars in millions, shares in thousands)
Stock Shares Amount Earnings Income (Loss)
(1)
Other Equity Income
Balance, December 31, 1998 $83 1,724,484 $14,837 $30,998 $ 152 $ (132) $45,938
Net income 7,882 7,882 $ 7,882
Other comprehensive loss, net of tax:
Net unrealized losses on
available-for-sale and marketable
equity securities (2,773) (2,773) (2,773)
Net unrealized losses on foreign
currency translation adjustments (37) (37) (37)
Comprehensive income $ 5,072
Cash dividends:
Common (3,193) (3,193)
Preferred (6) (6)
Common stock issued under
employee plans 30,501 1,423 (265) 1,158
Common stock repurchased (78,000) (4,858) (4,858)
Conversion of preferred stock (6) 284 6
Other 4 263 58 321
Balance, December 31, 1999 $77 1,677,273 $ 11,671 $35,681 $(2,658) $ (339) $44,432
Net income 7,517 7,517 $ 7,517
Other comprehensive income, net of tax:
Net unrealized gains on
available-for-sale and marketable
equity securities 1,910 1,910 1,910
Net unrealized gains on foreign
currency translation adjustments 2 2 2
Comprehensive income $ 9,429
Cash dividends:
Common (3,382) (3,382)
Preferred (6) (6)
Common stock issued under
employee plans 3,781 68 226 294
Common stock repurchased (67,577) (3,256) (3,256)
Conversion of preferred stock (5) 177 5
Other (22) 125 5 (13) 117
Balance, December 31, 2000 $72 1,613,632 $ 8,613 $ 39,815 $ (746) $ (126) $47,628
Net income 6,792 6,792 $ 6,792
Other comprehensive income, net of tax:
Net unrealized gains on
available-for-sale and marketable
equity securities 80 80 80
Net unrealized gains on foreign
currency translation adjustments 15 15 15
Net gains on derivatives 1,088 1,088 1,088
Comprehensive income $ 7,975
Cash dividends:
Common (3,627) (3,627)
Preferred (5) (5)
Common stock issued under
employee plans 27,301 1,059 62 1,121
Common stock repurchased (81,939) (4,716) (4,716)
Conversion of preferred stock (7) 298 7
Other 5 113 5 26 144
Balance, December 31, 2001 $65 1,559,297 $ 5,076 $42,980 $ 437 $ (38) $48,520
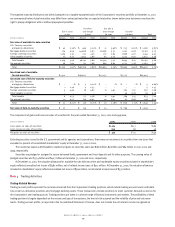
(1) Accumulated Other Comprehensive Income (Loss) consists of the after-tax valuation allowance for available-for-sale and marketable equity securities of $(480),
$(560) and $(2,470) at December 31, 2001, 2000, and 1999, respectively; foreign currency translation adjustments of $(171), $(186) and $(188) at December 31, 2001,
2000, and 1999, respectively; and net gains on derivatives of $1,088 at December 31, 2001.
See accompanying notes to consolidated financial statements.