Bank of America 2001 Annual Report Download - page 110
Download and view the complete annual report
Please find page 110 of the 2001 Bank of America annual report below. You can navigate through the pages in the report by either clicking on the pages listed below, or by using the keyword search tool below to find specific information within the annual report.-
 1
1 -
2
-
3
-
4
-
5
-
6
-
7
-
8
-
9
-
10
-
11
-
12
-
13
-
14
-
15
-
16
-
17
-
18
-
19
-
20
-
21
-
22
-
23
-
24
-
25
-
26
-
27
-
28
-
29
-
30
-
31
-
32
-
33
-
34
-
35
-
36
-
37
-
38
-
39
-
40
-
41
-
42
-
43
-
44
-
45
-
46
-
47
-
48
-
49
-
50
-
51
-
52
-
53
-
54
-
55
-
56
-
57
-
58
-
59
-
60
-
61
-
62
-
63
-
64
-
65
-
66
-
67
-
68
-
69
-
70
-
71
-
72
-
73
-
74
-
75
-
76
-
77
-
78
-
79
-
80
-
81
-
82
-
83
-
84
-
85
-
86
-
87
-
88
-
89
-
90
-
91
-
92
-
93
-
94
-
95
-
96
-
97
-
98
-
99
-
 100
100 -
 101
101 -
 102
102 -
 103
103 -
 104
104 -
 105
105 -
 106
106 -
 107
107 -
 108
108 -
 109
109 -
 110
110 -
 111
111 -
 112
112 -
 113
113 -
 114
114 -
 115
115 -
 116
116 -
 117
117 -
 118
118 -
 119
119 -
 120
120 -
121
-
122
-
123
-
124
 |
 |

BANK OF AMERICA 2001 ANNUAL REPORT
108
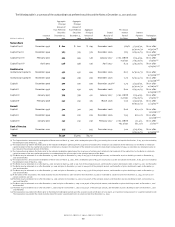
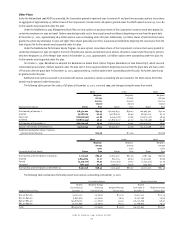
The following table summarizes the balances, changes in fair value of plan assets and benefit obligations, and the weighted average assumptions
as of and for the years ended December 31, 2001 and 2000. Prepaid and accrued benefit costs are reflected in other assets and other liabilities,
respectively, in the Consolidated Balance Sheet. For the Pension Plan, the asset valuation method recognizes 60 percent of the market gains or losses
in the first year, with the remaining 40 percent spread equally over the next four years. For both the Pension Plan and the Postretirement Health and
Life Plans, the expected return on plan assets will be decreased to 9.50% for 2002.
Qualified Nonqualified Postretirement
Pension Plan Pension Plans Health and Life Plans
(Dollars in millions)
2001 2000 2001 2000 2001 2000
Change in fair value of plan assets
(Primarily listed stocks, fixed income and real estate)
Fair value at January 1 $8,652 $8,063 $– $– $ 208 $ 202
Actual return on plan assets (154) (135) ––(14) 6
Company contributions 500 –98 49 69 63
Plan participant contributions ––––41 35
Acquisition/transfer 16 1,334 ––––
Benefits paid (750) (610) (98) (49) (110) (98)
Fair value at December 31 $8,264 $8,652 $– $– $194 $ 208
Change in benefit obligation
Benefit obligation at January 1 $8,011 $6,252 $ 534 $ 535 $840 $836
Service cost 202 153 22 10 11 11
Interest cost 560 519 40 39 64 58
Plan participant contributions ––––41 35
Plan amendments –325 212 29 6
Actuarial loss (gain) (434) 16 9(13) 69 (17)
Acquisition/transfer 17 1,392 20 –––
Effect of curtailments –(36) –––9
Benefits paid (750) (610) (98) (49) (110) (98)
Benefit obligation at December 31 $7,606 $8,011 $ 529 $ 534 $ 944 $840
Funded status
Overfunded (unfunded) status at December 31 $658 $ 641 $(529) $(534) $(750) $(632)
Unrecognized net actuarial loss (gain) 954 358 86 69 45 (39)
Unrecognized transition obligation (asset) –(2) 12355 387
Unrecognized prior service cost 468 521 61 70 44 19
Prepaid (accrued) benefit cost $2,080 $1,518 $(381) $(393) $(306) $(265)
Weighted average assumptions at December 31
Discount rate 7.25% 7.25% 7.25% 7.25% 7.25% 7.25%
Expected return on plan assets 10.00 10.00 n/a n/a 10.00 10.00
Rate of compensation increase 4.00 4.00 4.00 4.00 n/a n/a
Amounts recognized in the consolidated balance sheet at December 31, 2001 and 2000 are as follows:
Qualified Nonqualified Postretirement
Pension Plan Pension Plans Health and Life Plans
(Dollars in millions)
2001 2000 2001 2000 2001 2000
Prepaid benefit cost $2,080 $1,518 $– $– $– $–
Accrued benefit cost ––(381) (393) (306) (265)
Additional minimum liability ––(78) (86) ––
Intangible asset ––63 56 ––
Accumulated other comprehensive income ––15 30 ––
Net amount recognized at end of year $2,080 $1,518 $(381) $(393) $(306) $(265)