Bank of America 2001 Annual Report Download - page 40
Download and view the complete annual report
Please find page 40 of the 2001 Bank of America annual report below. You can navigate through the pages in the report by either clicking on the pages listed below, or by using the keyword search tool below to find specific information within the annual report.-
 1
1 -
2
-
3
-
4
-
5
-
6
-
7
-
8
-
9
-
10
-
11
-
12
-
13
-
14
-
15
-
16
-
17
-
18
-
19
-
20
-
21
-
22
-
23
-
24
-
25
-
26
-
27
-
28
-
29
-
 30
30 -
 31
31 -
 32
32 -
 33
33 -
 34
34 -
 35
35 -
 36
36 -
 37
37 -
 38
38 -
 39
39 -
 40
40 -
 41
41 -
 42
42 -
 43
43 -
 44
44 -
 45
45 -
 46
46 -
 47
47 -
 48
48 -
 49
49 -
 50
50 -
51
-
52
-
53
-
54
-
55
-
56
-
57
-
58
-
59
-
60
-
61
-
62
-
63
-
64
-
65
-
66
-
67
-
68
-
69
-
70
-
71
-
72
-
73
-
74
-
75
-
76
-
77
-
78
-
79
-
80
-
81
-
82
-
83
-
84
-
85
-
86
-
87
-
88
-
89
-
90
-
91
-
92
-
93
-
94
-
95
-
96
-
97
-
98
-
99
-
100
-
101
-
102
-
103
-
104
-
105
-
106
-
107
-
108
-
109
-
110
-
111
-
112
-
113
-
114
-
115
-
116
-
117
-
118
-
119
-
120
-
121
-
122
-
123
-
124
 |
 |

BANK OF AMERICA 2001 ANNUAL REPORT
38
>Cash basis earnings in 2001 rose $279 million, or five percent, due to the increases in net interest income and noninterest income discussed
above, partially offset by an increase in the provision for credit losses and a three percent increase in noninterest expense.
>
The provision for credit losses increased $691 million, or 62 percent, reflecting higher charge-offs in the commercial and bankcard loan portfolios.
>Shareholder value added increased $335 million over the prior year as a result of the increase in cash basis earnings and lower capital as a result
of reductions in commercial loan levels.
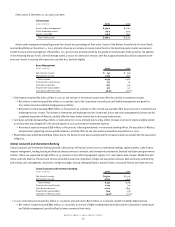
The major components of Consumer and Commercial Banking are Banking Regions, Consumer Products and Commercial Banking.
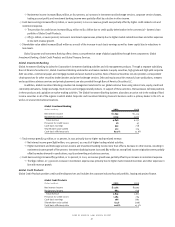
Banking Regions
Banking Regions serves consumer households in 21 states and the District of Columbia and overseas through its network of 4,251 banking centers,
13,113 ATMs, telephone and Internet channels on www.bankofamerica.com. Banking Regions provides a wide array of products and services, including
deposit products such as checking, money market savings accounts, time deposits and IRAs, debit card products and credit products such as home
equity, mortgage and personal auto loans. Banking Regions also includes small business banking providing treasury management, credit services,
community investment, check card, e-commerce and brokerage services to nearly two million small business relationships across the franchise.
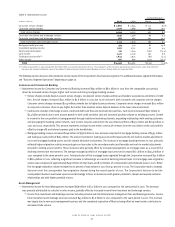
Banking Regions
(Dollars in millions)
2001 2000
Net interest income $8,561 $8,587
Noninterest income 3,866 3,547
Total revenue 12,427 12,134
Provision for credit losses 281 268
Cash basis earnings 3,108 3,056
Shareholder value added 1,767 1,693
Cash basis efficiency ratio 58.5% 58.1%
>Total revenue in 2001 increased $293 million, or two percent, as an increase in noninterest income was partially offset by a slight decrease in net
interest income.
>
Loan growth, primarily in residential mortgages and home equity lending, and deposit growth had a positive effect on net interest income
but were offset by the impact of the money market deposit pricing initiative.
>
Noninterest income increased $319 million, or nine percent, primarily due to an increase in consumer service charges of $170 million, or
seven percent, resulting from higher business volumes, and a $117 million, or 23 percent, increase in debit card income, driven by a higher
number of active debit cards from increased penetration and activation rates and an increase in purchase volume.
>Cash basis earnings increased $52 million, or two percent, in 2001, primarily attributable to the increase in revenue discussed above offset by a
three percent increase in noninterest expense.
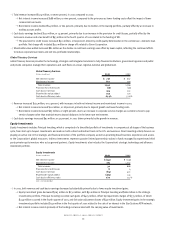
Consumer Products
Consumer Products provides specialized services such as the origination and servicing of residential mortgage loans, issuance and servicing of credit
cards, direct banking via telephone and Internet, lending and investing to develop low- and moderate-income communities, student lending and certain
insurance services. Consumer Products also provides retail finance and floorplan programs to marine, RV and auto dealerships.
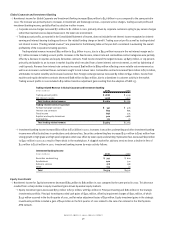
Consumer Products
(Dollars in millions)
2001 2000
Net interest income $2,211 $1,382
Noninterest income 3,109 2,822
Total revenue 5,320 4,204
Provision for credit losses 915 527
Cash basis earnings 1,447 1,077
Shareholder value added 1,012 649
Cash basis efficiency ratio 40.1% 47.7%
>Total revenue in 2001 increased $1.1 billion, or 27 percent, due to increases in both net interest income and noninterest income.
>
Net interest income increased $829 million, or 60 percent, primarily due to an increase in bankcard receivables from portfolio growth and
maturity of credit card securitizations as well as lower funding costs.
>
Noninterest income increased $287 million, or 10 percent, primarily due to strong mortgage banking revenue and increased credit card income.
Mortgage banking revenue increased $246 million, or 48 percent, due to higher origination activity and increased gains from higher loan sales
to the secondary market. Mortgage banking revenue also included the favorable net mark-to-market adjustments, included in trading account