Bank of America 2001 Annual Report Download - page 70
Download and view the complete annual report
Please find page 70 of the 2001 Bank of America annual report below. You can navigate through the pages in the report by either clicking on the pages listed below, or by using the keyword search tool below to find specific information within the annual report.-
 1
1 -
2
-
3
-
4
-
5
-
6
-
7
-
8
-
9
-
10
-
11
-
12
-
13
-
14
-
15
-
16
-
17
-
18
-
19
-
20
-
21
-
22
-
23
-
24
-
25
-
26
-
27
-
28
-
29
-
30
-
31
-
32
-
33
-
34
-
35
-
36
-
37
-
38
-
39
-
40
-
41
-
42
-
43
-
44
-
45
-
46
-
47
-
48
-
49
-
50
-
51
-
52
-
53
-
54
-
55
-
56
-
57
-
58
-
59
-
 60
60 -
 61
61 -
 62
62 -
 63
63 -
 64
64 -
 65
65 -
 66
66 -
 67
67 -
 68
68 -
 69
69 -
 70
70 -
 71
71 -
 72
72 -
 73
73 -
 74
74 -
 75
75 -
 76
76 -
 77
77 -
 78
78 -
 79
79 -
 80
80 -
81
-
82
-
83
-
84
-
85
-
86
-
87
-
88
-
89
-
90
-
91
-
92
-
93
-
94
-
95
-
96
-
97
-
98
-
99
-
100
-
101
-
102
-
103
-
104
-
105
-
106
-
107
-
108
-
109
-
110
-
111
-
112
-
113
-
114
-
115
-
116
-
117
-
118
-
119
-
120
-
121
-
122
-
123
-
124
 |
 |

BANK OF AMERICA 2001 ANNUAL REPORT
68
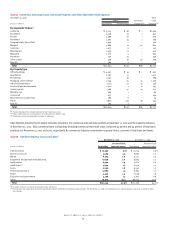
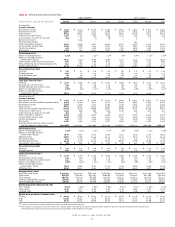
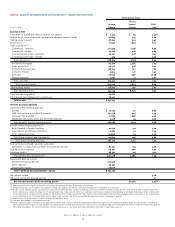
Table 23 Non-Trading Financial Instruments
December 31, 2001 Expected Maturity
Unrealized After
(Dollars in millions)
Total
(3)
Gains (Losses) 2002 2003 2004 2005 2006 2006
Assets(1)
Available-for-sale securities
Fixed rate
Book value $ 74,849 $ (831) $ 982 $ 4,751 $9,950 $20,167 $ 11,432 $ 27,567
Weighted average effective yield 6.03%
Variable rate
Book value $ 9,601 188 543 141 189 1,637 39 7,052
Weighted average effective yield 3.12%
Held-to-maturity securities(2)
Fixed rate
Book value $ 1,001 (40) 21 30 32 15 17 886
Weighted average effective yield 7.52%
Variable rate
Book value $ 48 – 6 6 11 4 1 20
Weighted average effective yield 3.98%
Loans(2,4)
Fixed rate
Book value $ 113,521 4,573 31,775 15,186 12,416 8,686 6,688 38,770
Weighted average effective yield 7.33%
Variable rate
Book value $ 196,906 (196) 97,227 29,241 19,065 17,062 8,847 25,464
Weighted average effective yield 5.27%
Liabilities(1)
Total deposits(5,6)
Fixed rate
Book value $229,956 (716) 70,973 12,364 13,953 13,544 13,370 105,752
Weighted average effective rate 1.29%
Variable rate
Book value $ 105,739 (20) 27,464 14,810 12,555 11,489 9,135 30,286
Weighted average effective rate 1.34%
Long-term debt(7,8)
Fixed rate
Book value $ 34,567 (1,841) 4,613 3,507 5,089 3,185 5,292 12,881
Weighted average effective rate 6.86%
Variable rate
Book value $ 27,899 (224) 8,971 4,430 7,018 2,487 3,836 1,157
Weighted average effective rate 2.35%
Trust preferred securities(7)
Fixed rate
Book value $ 4,388 (82) 900 350 – – 2,640 498
Weighted average effective rate 7.89%
Variable rate
Book value $ 1,142 – 400 ––––742
Weighted average effective rate 2.96%
(1) Fixed and variable rate classifications are based on contractual rates and are not modified for the impact of asset and liability management contracts.
(2) Expected maturities reflect the impact of prepayment assumptions.
(3) With the exception of available-for-sale securities, the book value does not include unrealized gains (losses).
(4) Excludes leases.
(5) When measuring and managing market risk associated with domestic deposits, such as savings and demand deposits, the Corporation considers that there is value in its long-term relation-
ships with depositors. The unrealized loss on deposits in this table does not consider the value of these long-term relationships; therefore, only certificates of deposits reflect an unrealized
gain or loss.
(6) Excludes foreign time deposits.
(7) Expected maturities of long-term debt and trust preferred securities reflect the Corporation’s ability to redeem such debt prior to contractual maturities.
(8) Excludes obligations under capital leases.