Bank of America 2001 Annual Report Download - page 68
Download and view the complete annual report
Please find page 68 of the 2001 Bank of America annual report below. You can navigate through the pages in the report by either clicking on the pages listed below, or by using the keyword search tool below to find specific information within the annual report.-
 1
1 -
2
-
3
-
4
-
5
-
6
-
7
-
8
-
9
-
10
-
11
-
12
-
13
-
14
-
15
-
16
-
17
-
18
-
19
-
20
-
21
-
22
-
23
-
24
-
25
-
26
-
27
-
28
-
29
-
30
-
31
-
32
-
33
-
34
-
35
-
36
-
37
-
38
-
39
-
40
-
41
-
42
-
43
-
44
-
45
-
46
-
47
-
48
-
49
-
50
-
51
-
52
-
53
-
54
-
55
-
56
-
57
-
 58
58 -
 59
59 -
 60
60 -
 61
61 -
 62
62 -
 63
63 -
 64
64 -
 65
65 -
 66
66 -
 67
67 -
 68
68 -
 69
69 -
 70
70 -
 71
71 -
 72
72 -
 73
73 -
 74
74 -
 75
75 -
 76
76 -
 77
77 -
 78
78 -
79
-
80
-
81
-
82
-
83
-
84
-
85
-
86
-
87
-
88
-
89
-
90
-
91
-
92
-
93
-
94
-
95
-
96
-
97
-
98
-
99
-
100
-
101
-
102
-
103
-
104
-
105
-
106
-
107
-
108
-
109
-
110
-
111
-
112
-
113
-
114
-
115
-
116
-
117
-
118
-
119
-
120
-
121
-
122
-
123
-
124
 |
 |

BANK OF AMERICA 2001 ANNUAL REPORT
66
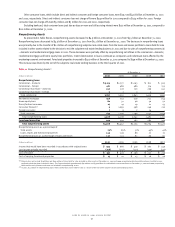
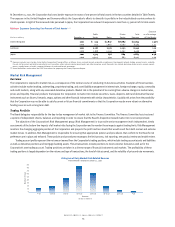
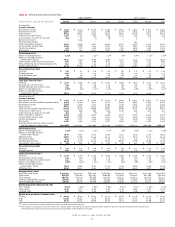
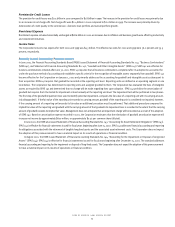
Total trading portfolio VAR increased during 2001 relative to 2000. This increase was due to increased activity in the interest rate business, particularly
in the United States, and the addition of mortgage banking assets to the VAR calculation for the real estate/mortgage portfolio in the first quarter of 2001.
Since the third quarter of 2000, the migration of trading books to a historical simulation approach has resulted in a lower VAR in equities and
foreign exchange and a higher VAR in commodities. VAR was not restated for previous quarters.
The following table summarizes the quarterly VAR in the Corporation’s trading portfolios for 2001:
Table 22 Quarterly Trading Activities Market Risk
2001
Fourth Quarter Third Quarter Second Quarter First Quarter
(US Dollar
Average High Low Average High Low Average High Low Average High Low
equivalents in millions)
VAR
(1)
VAR
(2)
VAR
(2)
VAR
(1)
VAR
(2)
VAR
(2)
VAR
(1)
VAR
(2)
VAR
(2)
VAR
(1)
VAR
(2)
VAR
(2)
Interest rate $ 31.9 $39.4 $24.4 $34.4 $47.0 $23.0 $38.8 $43.5 $32.6 $ 32.1 $46.2 $26.9
Foreign exchange 5.2 10.4 1.9 7.6 11.2 5.2 8.0 11.0 5.5 8.2 12.8 5.0
Commodities 7.8 10.9 5.7 4.8 8.2 1.5 2.7 5.7 1.3 1.8 3.8 .9
Equities 13.9 16.5 11.4 16.2 19.1 12.7 18.1 25.1 13.5 13.1 22.5 8.9
Fixed Income 13.9 17.3 8.8 13.0 15.8 10.3 10.7 16.9 6.6 6.2 8.0 3.0
Real estate/mortgage(3) 24.7 39.0 15.2 32.9 41.5 23.2 41.2 55.5 28.6 33.7 43.4 8.8
Total trading portfolio 46.0 57.0 35.8 53.1 63.3 45.4 61.3 69.9 55.2 50.0 59.6 42.4
(1) The average VAR for the total portfolio is less than the sum of the VARs of the individual portfolios due to risk offsets arising from the diversification of the portfolio.
(2) The high and low for the total portfolio may not equal the sum of the individual components as the highs or lows of the individual portfolios may have occurred on different trading days.
(3) The real estate/mortgage business is included in the fixed income category in the Trading-Related Revenue table in Note Four of the consolidated financial statements.
Stress Testing
In order to determine the sensitivity of the Corporation’s capital to the impact of historically large market moves with low probability, stress scenarios
are run against the trading portfolios. This stress testing should verify that, even under extreme market moves, the Corporation will preserve its capital.
The scenarios for each product are large standard deviation movements in the relevant markets that are based on significant historical or hypothetical
events. These results are calculated daily and reported as part of the regular reporting process.
In addition, specific stress scenarios are run regularly which represent extreme hypothetical, but plausible, events that would be of concern
given the Corporation’s current portfolio. The results of these specific scenarios are presented to the Corporation’s Trading Risk Committee as part of
its regular meetings. Examples of these specific stress scenarios include calculating the effects on the overall portfolio of an extreme Federal Reserve
Board tightening or easing of interest rates, a severe credit deterioration in the U.S., and a recession in Japan and the corresponding ripple effects globally.
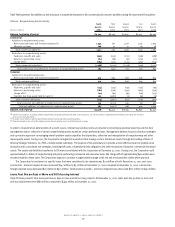
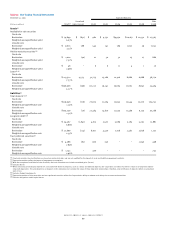
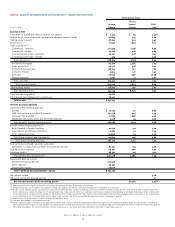
Non-Exchange Traded Commodity Contracts at Fair Value
The use of non-exchange traded or over the counter commodity contracts provides the Corporation with the ability to adapt to the varied requirements
of a wide customer base while efficiently mitigating its market risk. Non-exchange traded commodity contracts are stated at fair value, which is
generally based on dealer price estimates. These contracts are primarily oil and gas commodities contracts.
The table below summarizes the changes in the fair value for non-exchange traded commodity contracts for 2001:
Asset Liability
(Dollars in millions)
Positions Positions
Net fair value of contracts outstanding at January 1, 2001 $ 2,133 $ 1,881
Effects of legally enforceable master netting agreements 8,916 8,916
Gross fair value of contracts outstanding at January 1, 2001 11,049 10,797
Contracts realized or otherwise settled (8,542) (8,544)
Fair value of new contracts 3,032 2,699
Other changes in fair value (1,586) (1,317)
Gross fair value of contracts outstanding at December 31, 2001 3,953 3,635
Effects of legally enforceable master netting agreements (2,625) (2,625)
Net fair value of contracts outstanding at December 31, 2001 $ 1,328 $ 1,010