Bank of America 2001 Annual Report Download - page 69
Download and view the complete annual report
Please find page 69 of the 2001 Bank of America annual report below. You can navigate through the pages in the report by either clicking on the pages listed below, or by using the keyword search tool below to find specific information within the annual report.-
 1
1 -
2
-
3
-
4
-
5
-
6
-
7
-
8
-
9
-
10
-
11
-
12
-
13
-
14
-
15
-
16
-
17
-
18
-
19
-
20
-
21
-
22
-
23
-
24
-
25
-
26
-
27
-
28
-
29
-
30
-
31
-
32
-
33
-
34
-
35
-
36
-
37
-
38
-
39
-
40
-
41
-
42
-
43
-
44
-
45
-
46
-
47
-
48
-
49
-
50
-
51
-
52
-
53
-
54
-
55
-
56
-
57
-
58
-
 59
59 -
 60
60 -
 61
61 -
 62
62 -
 63
63 -
 64
64 -
 65
65 -
 66
66 -
 67
67 -
 68
68 -
 69
69 -
 70
70 -
 71
71 -
 72
72 -
 73
73 -
 74
74 -
 75
75 -
 76
76 -
 77
77 -
 78
78 -
 79
79 -
80
-
81
-
82
-
83
-
84
-
85
-
86
-
87
-
88
-
89
-
90
-
91
-
92
-
93
-
94
-
95
-
96
-
97
-
98
-
99
-
100
-
101
-
102
-
103
-
104
-
105
-
106
-
107
-
108
-
109
-
110
-
111
-
112
-
113
-
114
-
115
-
116
-
117
-
118
-
119
-
120
-
121
-
122
-
123
-
124
 |
 |

BANK OF AMERICA 2001 ANNUAL REPORT
67
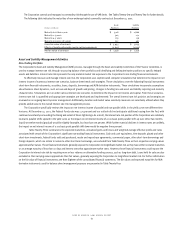
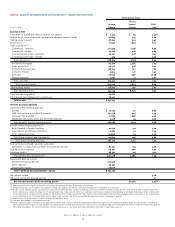
The Corporation controls and manages its commodity risk through the use of VAR limits. See Tables Twenty-One and Twenty-Two for further details.
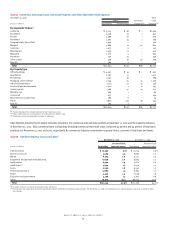
The following table indicates the maturities of non-exchange traded commodity contracts at December 31, 2001:
Asset Liability
(Dollars in millions)
Positions Positions
Maturity less than 1 year $ 3,118 $ 2,866
Maturity 1-3 years 304 172
Maturity 4-5 years 179 136
Maturity in excess of 5 years 352 461
Gross fair value of contracts $ 3,953 $ 3,635
Effects of legally enforceable master netting agreements (2,625) (2,625)
Net fair value of contracts $ 1,328 $ 1,010
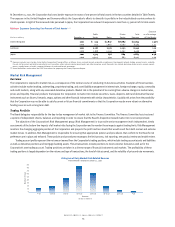
Asset and Liability Management Activities
Non-Trading Portfolio
The Corporation’s Asset and Liability Management (ALM) process, managed through the Asset and Liability Committee of the Finance Committee, is
used to manage interest rate risk through structuring balance sheet portfolios and identifying and linking derivative positions to specific hedged
assets and liabilities. Interest rate risk represents the only material market risk exposure to the Corporation’s non-trading financial instruments.
To effectively measure and manage interest rate risk, the Corporation uses sophisticated computer simulations that determine the impact on net
interest income of numerous interest rate scenarios, balance sheet trends and strategies. These simulations cover the following financial instruments:
short-term financial instruments, securities, loans, deposits, borrowings and ALM derivative instruments. These simulations incorporate assumptions
about balance sheet dynamics, such as loan and deposit growth and pricing, changes in funding mix and asset and liability repricing and maturity
characteristics. Simulations are run under various interest rate scenarios to determine the impact on net income and capital. From these scenarios,
interest rate risk is quantified and appropriate strategies are developed and implemented. The overall interest rate risk position and strategies are
reviewed on an ongoing basis by senior management. Additionally, duration and market value sensitivity measures are selectively utilized where they
provide added value to the overall interest rate risk management process.
The Corporation specifically reviews the impact on net interest income of parallel and non-parallel shifts in the yield curve over different time
horizons. At December 31, 2001, the Federal Funds rate was 1.75 percent and our outlook did not anticipate additional easing from the Fed, with
continued uncertainty surrounding the timing and extent of future tightenings. As a result, the interest rate risk position of the Corporation was relatively
neutral to parallel shifts upward in the yield curve as the impact on net interest income of a 100 basis point parallel shift, up over either two months
(rapid) or twelve months (gradual) would be slightly favorable, but less than one percent. While further material declines in interest rates are unlikely,
the impact on net interest income of a 100 basis point parallel shift down would be negative three percent.
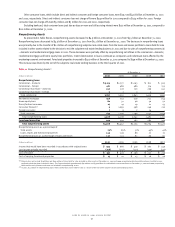
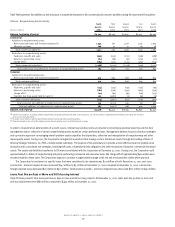
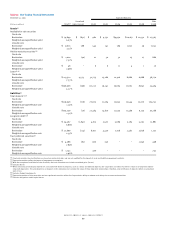
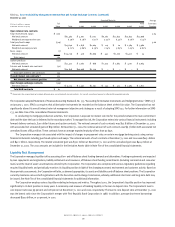
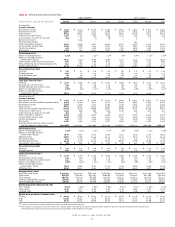
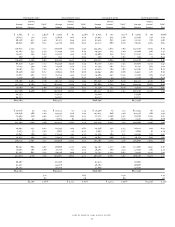
Table Twenty-Three summarizes the expected maturities, unrealized gains and losses and weighted average effective yields and rates
associated with certain of the Corporation’s significant non-trading financial instruments. Cash and cash equivalents, time deposits placed and other
short-term investments, federal funds sold and purchased, resale and repurchase agreements, commercial paper, other short-term borrowings and
foreign deposits, which are similar in nature to other short-term borrowings, are excluded from Table Twenty-Three as their respective carrying values
approximate fair values. These financial instruments generally expose the Corporation to insignificant market risk as they have either no stated maturities
or an average maturity of less than 30 days and interest rates that approximate market rates. However, these financial instruments could expose the
Corporation to interest rate risk by requiring more or less reliance on alternative funding sources, such as long-term debt. Loans held for sale are also
excluded as their carrying values approximate their fair values, generally exposing the Corporation to insignificant market risk. For further information
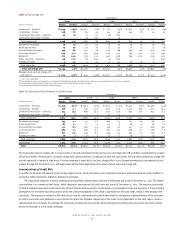
on the fair value of financial instruments, see Note Eighteen of the consolidated financial statements. The fair values and expected maturities for ALM
derivative instruments used for balance sheet management purposes are presented in Table Twenty-Four.