Bank of America 2001 Annual Report Download - page 64
Download and view the complete annual report
Please find page 64 of the 2001 Bank of America annual report below. You can navigate through the pages in the report by either clicking on the pages listed below, or by using the keyword search tool below to find specific information within the annual report.-
 1
1 -
2
-
3
-
4
-
5
-
6
-
7
-
8
-
9
-
10
-
11
-
12
-
13
-
14
-
15
-
16
-
17
-
18
-
19
-
20
-
21
-
22
-
23
-
24
-
25
-
26
-
27
-
28
-
29
-
30
-
31
-
32
-
33
-
34
-
35
-
36
-
37
-
38
-
39
-
40
-
41
-
42
-
43
-
44
-
45
-
46
-
47
-
48
-
49
-
50
-
51
-
52
-
53
-
 54
54 -
 55
55 -
 56
56 -
 57
57 -
 58
58 -
 59
59 -
 60
60 -
 61
61 -
 62
62 -
 63
63 -
 64
64 -
 65
65 -
 66
66 -
 67
67 -
 68
68 -
 69
69 -
 70
70 -
 71
71 -
 72
72 -
 73
73 -
 74
74 -
75
-
76
-
77
-
78
-
79
-
80
-
81
-
82
-
83
-
84
-
85
-
86
-
87
-
88
-
89
-
90
-
91
-
92
-
93
-
94
-
95
-
96
-
97
-
98
-
99
-
100
-
101
-
102
-
103
-
104
-
105
-
106
-
107
-
108
-
109
-
110
-
111
-
112
-
113
-
114
-
115
-
116
-
117
-
118
-
119
-
120
-
121
-
122
-
123
-
124
 |
 |

BANK OF AMERICA 2001 ANNUAL REPORT
62
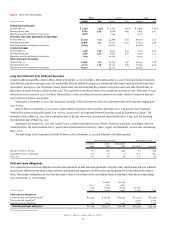
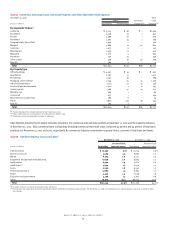
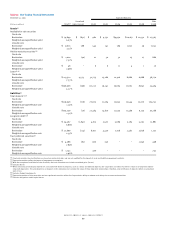
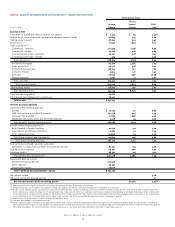
Table 17 Commercial Real Estate Loans, Foreclosed Properties and Other Real Estate Credit Exposure
December 31, 2001 Other
Loans Foreclosed Credit
(Dollars in millions)
Outstanding Nonperforming Properties
(1)
Exposure
(2)
By Geographic Region(3)
California $ 5,225 $ 48 $ 1 $ 1,064
Southwest 3,239 24 1 952
Florida 2,399 29 – 509
Northwest 2,363 14 1 169
Geographically diversified 1,950 – – 381
Midwest 1,688 21 22 802
Carolinas 1,472 6 – 342
Mid-Atlantic 1,430 23 – 429
Midsouth 1,276 5 – 367
Northeast 750 51 – 558
Other states 478 19 43 199
Non-US 384 3 – 5
Total $22,654 $243 $68 $5,777
By Property Type
Office buildings $ 4,567 $ 14 $ – $ 667
Apartments 3,797 21 – 1,551
Residential 3,157 28 – 188
Shopping centers/retail 2,754 15 15 1,306
Industrial/warehouse 2,011 23 15 246
Land and land development 1,501 1 6 193
Hotels/motels 1,186 27 14 277
Multiple use 694 1 – 64
Unsecured 433 – – 454
Miscellaneous commercial 289 6 – 34
Other 1,881 104 18 792
Non-US 384 3 – 5
Total $22,654 $243 $68 $5,777
(1) Foreclosed properties include commercial real estate loans only.
(2) Other credit exposures include letters of credit and loans held for sale.
(3) Distribution based on geographic location of collateral.
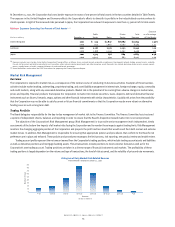
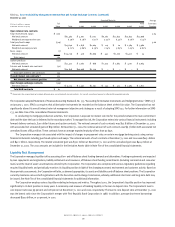
Table Eighteen presents the ten largest industries included in the commercial loan and lease portfolio at December 31, 2001 and the respective balances
at December 31, 2000. Total commercial loans outstanding, excluding commercial real estate loans, comprised 43 percent and 45 percent of total loans
and leases at December 31, 2001 and 2000, respectively. No commercial industry concentration is greater than 3.1 percent of total loans and leases.
Table 18 Significant Industry Loans and Leases(1)
December 31, 2001 December 31, 2000
Percent of Total Percent of Total
(Dollars in millions)
Outstanding Loans and Leases Outstanding Loans and Leases
Transportation $ 10,350 3.1% $ 11,704 3.0%
Business services 7,569 2.3 8,883 2.3
Media 6,704 2.0 9,322 2.4
Equipment and general manufacturing 6,648 2.0 8,982 2.3
Agribusiness 6,390 1.9 7,672 2.0
Healthcare(2) 5,444 1.7 8,110 2.1
Autos 5,290 1.6 6,741 1.7
Telecommunications 4,882 1.5 6,801 1.7
Retail 4,450 1.4 7,049 1.8
Education and government 4,198 1.3 3,671 0.9
Other 79,319 24.1 98,171 25.0
Total $141,244 42.9% $177,106 45.2%
(1) Includes only non-real estate commercial loans and leases.
(2) During 2001, the Corporation revised its healthcare industry definition to include pharmaceuticals. The December 31, 2000 outstanding balance and percentage have been restated to reflect
this change.