Bank of America 2001 Annual Report Download - page 94
Download and view the complete annual report
Please find page 94 of the 2001 Bank of America annual report below. You can navigate through the pages in the report by either clicking on the pages listed below, or by using the keyword search tool below to find specific information within the annual report.-
 1
1 -
2
-
3
-
4
-
5
-
6
-
7
-
8
-
9
-
10
-
11
-
12
-
13
-
14
-
15
-
16
-
17
-
18
-
19
-
20
-
21
-
22
-
23
-
24
-
25
-
26
-
27
-
28
-
29
-
30
-
31
-
32
-
33
-
34
-
35
-
36
-
37
-
38
-
39
-
40
-
41
-
42
-
43
-
44
-
45
-
46
-
47
-
48
-
49
-
50
-
51
-
52
-
53
-
54
-
55
-
56
-
57
-
58
-
59
-
60
-
61
-
62
-
63
-
64
-
65
-
66
-
67
-
68
-
69
-
70
-
71
-
72
-
73
-
74
-
75
-
76
-
77
-
78
-
79
-
80
-
81
-
82
-
83
-
 84
84 -
 85
85 -
 86
86 -
 87
87 -
 88
88 -
 89
89 -
 90
90 -
 91
91 -
 92
92 -
 93
93 -
 94
94 -
 95
95 -
 96
96 -
 97
97 -
 98
98 -
 99
99 -
 100
100 -
 101
101 -
 102
102 -
 103
103 -
 104
104 -
105
-
106
-
107
-
108
-
109
-
110
-
111
-
112
-
113
-
114
-
115
-
116
-
117
-
118
-
119
-
120
-
121
-
122
-
123
-
124
 |
 |

BANK OF AMERICA 2001 ANNUAL REPORT
92
of the potential change in value of contracts over their remaining lives are considered. In managing credit risk associated with its derivative activities,
the Corporation deals primarily with commercial banks, broker-dealers and corporations. To minimize credit risk, the Corporation enters into legally
enforceable master netting arrangements, which reduce risk by permitting the closeout and netting of transactions with the same counterparty upon
occurrence of certain events. In addition, the Corporation reduces credit risk by obtaining collateral where appropriate. Required collateral levels vary
depending on the credit risk rating and the type of counterparty. Generally, the Corporation accepts collateral in the form of cash, U.S. Treasury securities,
and other marketable securities. Collateral of $10.8 billion was held on derivative assets of $22.1 billion at December 31, 2001.
The Corporation also provides credit derivatives to sophisticated customers who wish to hedge existing credit exposures or take on additional
credit exposure to generate revenue. The Corporation’s credit derivative positions at December 31, 2001 and 2000 primarily consisted of credit default
swaps and total return swaps.
A portion of the derivative activity involves exchange-traded instruments. Because exchange-traded instruments conform to standard terms and
are subject to policies set by the exchange involved, including counterparty approval, margin requirements and security deposit requirements, the credit
risk is considered minimal.
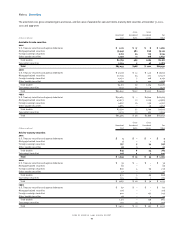
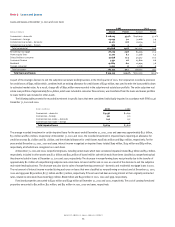
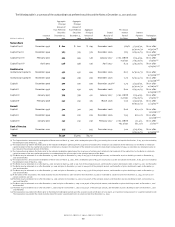
The following table presents the notional or contract and credit risk amounts at December 31, 2001 and 2000 of the Corporation’s derivative asset
positions held for trading and hedging purposes. These derivative positions are primarily executed in the over-the-counter market. The credit risk
amounts presented in the following table do not consider the value of any collateral held but take into consideration the effects of legally enforceable
master netting agreements.
Derivative Assets(1)
December 31, 2001 December 31, 2000
(2)
Contract/ Credit Contract/ Credit
(Dollars in millions)
Notional Risk Notional Risk
Interest rate contracts
Swaps $5,267,608 $ 9,550 $3,256,992 $ 3,236
Futures and forwards 1,663,109 67 1,227,537 57
Written options 678,242 – 664,108 –
Purchased options 704,159 2,165 601,828 145
Foreign exchange contracts
Swaps 140,778 2,274 61,035 1,424
Spot, futures and forwards 654,026 2,496 682,665 3,215
Written options 57,963 – 35,161 –
Purchased options 55,050 496 32,639 380
Equity contracts
Swaps 14,504 562 17,482 637
Futures and forwards 46,970 44 61,004 353
Written options 21,009 – 30,976 –
Purchased options 28,902 2,511 36,304 3,670
Commodity contracts
Swaps 6,600 1,152 9,126 1,902
Futures and forwards 2,176 – 2,098 81
Written options 8,231 – 12,603 –
Purchased options 8,219 199 10,515 228
Credit derivatives 57,182 631 40,638 206
Net replacement cost $22,147 $15,534
(1) Includes both long and short derivative positions.
(2) The amounts at December 31, 2000 do not reflect derivative positions that were off-balance sheet prior to the adoption of SFAS 133.
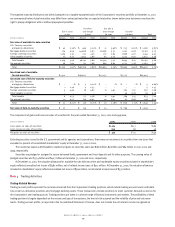
The average fair value of derivative assets for 2001 and 2000 was $19.8 billion and $17.9 billion, respectively. The average fair value of derivative
liabilities for 2001 and 2000 was $17.4 billion and $19.8 billion, respectively.
Asset and Liability Management (ALM) Activities
Risk management interest rate contracts and foreign exchange contracts are utilized in the Corporation’s ALM process. The Corporation maintains an
overall interest rate risk management strategy that incorporates the use of interest rate contracts to minimize significant unplanned fluctuations in
earnings that are caused by interest rate volatility. The Corporation’s goal is to manage interest rate sensitivity so that movements in interest rates do
not adversely affect net interest income. As a result of interest rate fluctuations, hedged fixed-rate assets and liabilities appreciate or depreciate in
market value. Gains or losses on the derivative instruments that are linked to the hedged fixed-rate assets and liabilities are expected to substantially
offset this unrealized appreciation or depreciation. Interest income and interest expense on hedged variable-rate assets and liabilities, respectively,
increases or decreases as a result of interest rate fluctuations. Gains and losses on the derivative instruments that are linked to these hedged assets
and liabilities are expected to substantially offset this variability in earnings.