Bank of America 2001 Annual Report Download - page 74
Download and view the complete annual report
Please find page 74 of the 2001 Bank of America annual report below. You can navigate through the pages in the report by either clicking on the pages listed below, or by using the keyword search tool below to find specific information within the annual report.-
 1
1 -
2
-
3
-
4
-
5
-
6
-
7
-
8
-
9
-
10
-
11
-
12
-
13
-
14
-
15
-
16
-
17
-
18
-
19
-
20
-
21
-
22
-
23
-
24
-
25
-
26
-
27
-
28
-
29
-
30
-
31
-
32
-
33
-
34
-
35
-
36
-
37
-
38
-
39
-
40
-
41
-
42
-
43
-
44
-
45
-
46
-
47
-
48
-
49
-
50
-
51
-
52
-
53
-
54
-
55
-
56
-
57
-
58
-
59
-
60
-
61
-
62
-
63
-
 64
64 -
 65
65 -
 66
66 -
 67
67 -
 68
68 -
 69
69 -
 70
70 -
 71
71 -
 72
72 -
 73
73 -
 74
74 -
 75
75 -
 76
76 -
 77
77 -
 78
78 -
 79
79 -
 80
80 -
 81
81 -
 82
82 -
 83
83 -
 84
84 -
85
-
86
-
87
-
88
-
89
-
90
-
91
-
92
-
93
-
94
-
95
-
96
-
97
-
98
-
99
-
100
-
101
-
102
-
103
-
104
-
105
-
106
-
107
-
108
-
109
-
110
-
111
-
112
-
113
-
114
-
115
-
116
-
117
-
118
-
119
-
120
-
121
-
122
-
123
-
124
 |
 |

BANK OF AMERICA 2001 ANNUAL REPORT
72
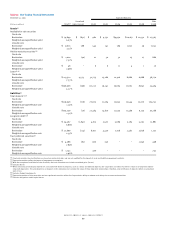
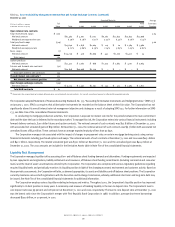
Table 26 Quarterly Average Balances and Interest Rates – Taxable-Equivalent Basis
Fourth Quarter 2001
Interest
Average Income/ Yield/
(Dollars in millions) Balance Expense Rate
Earning assets
Time deposits placed and other short-term investments $7,255 $ 64 3.47%
Federal funds sold and securities purchased under agreements to resell 38,825 253 2.60
Trading account assets 67,535 920 5.43
Securities(1) 71,454 1,090 6.10
Loans and leases(2):
Commercial – domestic 121,399 2,138 6.99
Commercial – foreign 23,789 278 4.63
Commercial real estate – domestic 23,051 316 5.45
Commercial real estate – foreign 375 4 4.49
Total commercial 168,614 2,736 6.44
Residential mortgage 78,366 1,385 7.05
Home equity lines 22,227 340 6.07
Direct/Indirect consumer 38,074 752 7.83
Consumer finance 5,324 127 9.55
Bankcard 18,656 498 10.58
Foreign consumer 2,093 21 4.02
Total consumer 164,740 3,123 7.54
Total loans and leases 333,354 5,859 6.99
Other earning assets 36,782 707 7.67
Total earning assets(3) 555,205 8,893 6.37
Cash and cash equivalents 23,182
Other assets, less allowance for credit losses 73,410
Total assets $ 651,797
Interest-bearing liabilities
Domestic interest-bearing deposits:
Savings $ 20,132 42 0.83
NOW and money market deposit accounts 121,758 426 1.39
Consumer CDs and IRAs 71,895 898 4.96
Negotiable CDs, public funds and other time deposits 5,196 44 3.39
Total domestic interest-bearing deposits 218,981 1,410 2.56
Foreign interest-bearing deposits(4):
Banks located in foreign countries 20,771 170 3.22
Governments and official institutions 2,965 20 2.74
Time, savings and other 21,858 113 2.06
Total foreign interest-bearing deposits 45,594 303 2.63
Total interest-bearing deposits 264,575 1,713 2.57
Federal funds purchased, securities sold under
agreements to repurchase and other short-term borrowings 87,291 700 3.18
Trading account liabilities 29,921 268 3.55
Long-term debt(5) 68,141 707 4.15
Total interest-bearing liabilities(6) 449,928 3,388 2.99
Noninterest-bearing sources:
Noninterest-bearing deposits 103,596
Other liabilities 49,357
Shareholders’ equity 48,916
Total liabilities and shareholders’ equity $ 651,797
Net interest spread 3.38
Impact of noninterest-bearing sources .57
Net interest income/yield on earning assets $5,505 3.95%
(1) The average balance and yield on securities are based on the average of historical amortized cost balances.
(2) Nonperforming loans are included in the respective average loan balances. Income on such nonperforming loans is recognized on a cash basis.
(3) Interest income includes taxable-equivalent basis adjustments of $88, $86, $87 and $82 in the fourth, third, second and first quarters of 2001 and $94 in the fourth quarter of 2000, respectively.
Interest income also includes the impact of risk management interest rate contracts, which increased (decreased) interest income on the underlying assets $473, $284, $194 and $27 in the fourth,
third, second and first quarters of 2001 and $(31) in the fourth quarter of 2000, respectively. These amounts were substantially offset by corresponding decreases or increases in the income earned
on the underlying assets. For further information on interest rate contracts, see “Asset and Liability Management Activities” beginning on page 67.
(4) Primarily consists of time deposits in denominations of $100,000 or more.
(5) Long-term debt includes trust preferred securities.
(6) Interest expense includes the impact of risk management interest rate contracts, which (increased) decreased interest expense on the underlying liabilities $(40), $31, $49 and $23 in the fourth,
third, second and first quarters of 2001 and $(7) in the fourth quarter of 2000, respectively. These amounts were substantially offset by corresponding decreases or increases in the interest paid on
the underlying liabilities. For further information on interest rate contracts, see “Asset and Liability Management Activities” beginning on page 67.