Bank of America 2001 Annual Report Download - page 49
Download and view the complete annual report
Please find page 49 of the 2001 Bank of America annual report below. You can navigate through the pages in the report by either clicking on the pages listed below, or by using the keyword search tool below to find specific information within the annual report.-
 1
1 -
2
-
3
-
4
-
5
-
6
-
7
-
8
-
9
-
10
-
11
-
12
-
13
-
14
-
15
-
16
-
17
-
18
-
19
-
20
-
21
-
22
-
23
-
24
-
25
-
26
-
27
-
28
-
29
-
30
-
31
-
32
-
33
-
34
-
35
-
36
-
37
-
38
-
 39
39 -
 40
40 -
 41
41 -
 42
42 -
 43
43 -
 44
44 -
 45
45 -
 46
46 -
 47
47 -
 48
48 -
 49
49 -
 50
50 -
 51
51 -
 52
52 -
 53
53 -
 54
54 -
 55
55 -
 56
56 -
 57
57 -
 58
58 -
 59
59 -
60
-
61
-
62
-
63
-
64
-
65
-
66
-
67
-
68
-
69
-
70
-
71
-
72
-
73
-
74
-
75
-
76
-
77
-
78
-
79
-
80
-
81
-
82
-
83
-
84
-
85
-
86
-
87
-
88
-
89
-
90
-
91
-
92
-
93
-
94
-
95
-
96
-
97
-
98
-
99
-
100
-
101
-
102
-
103
-
104
-
105
-
106
-
107
-
108
-
109
-
110
-
111
-
112
-
113
-
114
-
115
-
116
-
117
-
118
-
119
-
120
-
121
-
122
-
123
-
124
 |
 |

BANK OF AMERICA 2001 ANNUAL REPORT
47
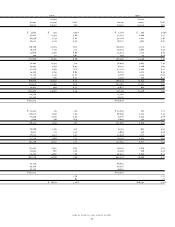
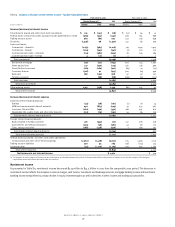
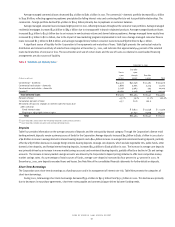
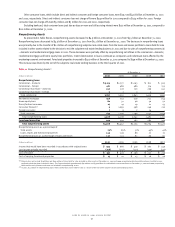
Table 6 Noninterest Income
Increase/(Decrease)
(Dollars in millions)
2001 2000 Amount Percent
Consumer service charges $2,866 $ 2,654 $ 212 8.0%
Corporate service charges 2,078 1,889 189 10.0
Total service charges 4,944 4,543 401 8.8
Consumer investment and brokerage services 1,546 1,466 80 5.5
Corporate investment and brokerage services 566 463 103 22.2
Total investment and brokerage services 2,112 1,929 183 9.5
Mortgage banking income 593 512 81 15.8
Investment banking income 1,579 1,512 67 4.4
Equity investment gains 291 1,054 (763) (72.4)
Card income 2,421 2,229 192 8.6
Trading account profits(1) 1,842 1,923 (81) (4.2)
Other income 566 880 (314) (35.7)
Total $14,348 $14,582 $(234) (1.6)%
(1) Trading account profits in 2001 included the $83 million SFAS 133 transition adjustment net loss. The components of the transition adjustment by segment were a gain of $4 million for
Consumer and Commercial Banking, a gain of $19 million for Global Corporate and Investment Banking and a loss of $106 million for Corporate Other.
The following section discusses the noninterest income results of the Corporation’s four business segments. For additional business segment information,
see “Business Segment Operations” beginning on page 36.
Consumer and Commercial Banking
>Noninterest income for Consumer and Commercial Banking increased $652 million to $8.0 billion in 2001 from the comparable 2000 period,
driven by increased service charges, higher card income and strong mortgage banking revenue.
>
Service charges include deposit account service charges, non-deposit service charges and fees and bankers’ acceptances and letters of credit
fees. Service charges increased $321 million to $3.8 billion in 2001 due to an increase in both consumer and corporate service charges.
Consumer service charges increased $204 million primarily due to higher business volumes. Corporate service charges increased $117 million
as corporate customers chose to pay higher fees rather than maintain excess deposit balances in the lower rate environment.
>
Card income includes interchange income, credit and debit card fees and merchant discount fees. Card income increased $192 million to
$2.4 billion primarily due to new account growth in both credit and debit card and increased purchase volume on existing accounts. Growth
in income for the core portfolio is being generated through traditional marketing channels, expanding relationships with existing customers
and leveraging the banking center network. Card income includes activity from the securitized portfolio of $193 million and $209 million in
2001 and 2000, respectively. This amount represents residual income which consists of revenues from the securitized credit card portfolio
offset by charge-offs and interest expense paid to the bondholders.
>
Mortgage banking revenue increased $246 million to $758 million in 2001 and was comprised of mortgage banking income of $593 million
and trading account profits of $165 million. The amount recorded in trading account profits represents the net mark-to-market adjustments
on certain mortgage banking assets and the related derivative instruments. The increase in mortgage banking revenue in 2001 primarily
reflected higher origination activity, increased gains on loan sales to the secondary market and favorable net mark-to-market adjustments
included in trading account profits. These increases were partially offset by increased prepayments on mortgage loans as a result of the
declining interest rate environment. The average managed portfolio of mortgage loans serviced increased $6.1 billion to $334.8 billion in
2001 compared to the same period in 2000. Total production of first mortgage loans originated through the Corporation increased $30.6 billion
to $82.4 billion in 2001, reflecting a significant increase in refinancings as a result of declining interest rates. First mortgage loan origination
volume was composed of approximately $49.6 billion of retail loans and $32.8 billion of correspondent and wholesale loans in 2001. Retail
first mortgage origination volume increased to 60 percent of total volume in 2001 from 42 percent in 2000. The Corporation made a strategic
decision to exit the correspondent loan origination channel during the second quarter of 2001. The Corporation’s decision to exit the
correspondent business was based upon its overall strategy to focus on businesses with greater potential to deepen and expand customer
relationships and with higher potential returns.
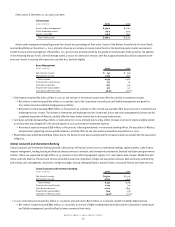
Asset Management
>Noninterest income for Asset Management decreased $68 million to $1.7 billion in 2001 compared to the same period in 2000. The decrease
was primarily attributable to a decline in other income, partially offset by increased income from investment and brokerage services.
>
Income from investment and brokerage services includes personal and institutional asset management fees and brokerage income. Income
from investment and brokerage services increased $45 million to $1.6 billion in 2001 compared to the same period in 2000. This increase
was largely due to new asset management business and the completed acquisition of Marsico being offset by lower broker activity due to
decreased trade volume.