Bank of America 2001 Annual Report Download - page 58
Download and view the complete annual report
Please find page 58 of the 2001 Bank of America annual report below. You can navigate through the pages in the report by either clicking on the pages listed below, or by using the keyword search tool below to find specific information within the annual report.-
 1
1 -
2
-
3
-
4
-
5
-
6
-
7
-
8
-
9
-
10
-
11
-
12
-
13
-
14
-
15
-
16
-
17
-
18
-
19
-
20
-
21
-
22
-
23
-
24
-
25
-
26
-
27
-
28
-
29
-
30
-
31
-
32
-
33
-
34
-
35
-
36
-
37
-
38
-
39
-
40
-
41
-
42
-
43
-
44
-
45
-
46
-
47
-
 48
48 -
 49
49 -
 50
50 -
 51
51 -
 52
52 -
 53
53 -
 54
54 -
 55
55 -
 56
56 -
 57
57 -
 58
58 -
 59
59 -
 60
60 -
 61
61 -
 62
62 -
 63
63 -
 64
64 -
 65
65 -
 66
66 -
 67
67 -
 68
68 -
69
-
70
-
71
-
72
-
73
-
74
-
75
-
76
-
77
-
78
-
79
-
80
-
81
-
82
-
83
-
84
-
85
-
86
-
87
-
88
-
89
-
90
-
91
-
92
-
93
-
94
-
95
-
96
-
97
-
98
-
99
-
100
-
101
-
102
-
103
-
104
-
105
-
106
-
107
-
108
-
109
-
110
-
111
-
112
-
113
-
114
-
115
-
116
-
117
-
118
-
119
-
120
-
121
-
122
-
123
-
124
 |
 |

BANK OF AMERICA 2001 ANNUAL REPORT
56
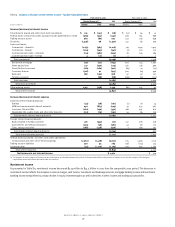
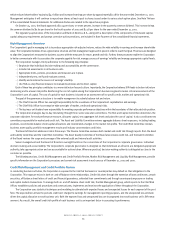
Commercial Portfolio
At December 31, 2001 and 2000, total commercial loans outstanding totaled $163.9 billion and $203.5 billion, respectively. Domestic commercial loans,
including commercial real estate, accounted for 86 percent and 85 percent of total commercial loans at December 31, 2001 and 2000, respectively.
Commercial – domestic loans outstanding totaled $118.2 billion and $146.0 billion at December 31, 2001 and 2000, respectively. The Corporation
had commercial – domestic loan net charge-offs of $1.9 billion for 2001, compared to $1.3 billion for 2000. Net charge-offs increased primarily due
to deterioration in credit quality stemming from the weak economic environment, the sale of distressed loans in 2001 and fourth quarter charge-offs
of $210 million related to Enron Corporation. In addition to the Enron loan charge-offs, the Corporation also wrote off $21 million in Enron securities
related to a collateralized loan obligation. Nonperforming commercial – domestic loans were $3.1 billion, or 2.64 percent of commercial – domestic
loans, at December 31, 2001, compared to $2.8 billion, or 1.90 percent, at December 31, 2000. The increase in nonperforming loans was primarily
driven by the weakening economic environment which impacted various industries and business segments, partially offset by sales of nonperforming
loans. In addition, the remaining Enron loan balance of $226 million, of which $42 million was unsecured, was classified as nonperforming subsequent
to the charge-off in the fourth quarter. Commercial – domestic loans past due 90 days or more and still accruing interest were $175 million at
December 31, 2001, compared to $141 million at December 31, 2000.
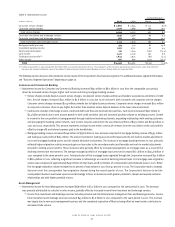
Commercial – foreign loans outstanding totaled $23.0 billion and $31.1 billion at December 31, 2001 and 2000, respectively. The Corporation had
commercial – foreign loan net charge-offs for 2001 of $208 million, compared to $86 million for 2000. Nonperforming commercial – foreign loans were
$461 million, or 2.00 percent of commercial – foreign loans, at December 31, 2001, compared to $486 million, or 1.56 percent, at December 31, 2000.
Commercial – foreign loans past due 90 days or more and still accruing interest were $6 million at December 31, 2001 compared to $37 million at
December 31, 2000. For additional information, see the International Exposure discussion beginning on page 63.
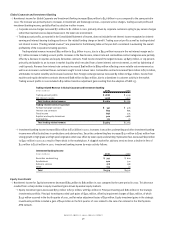
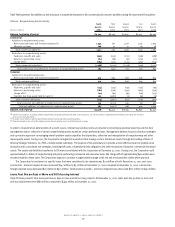
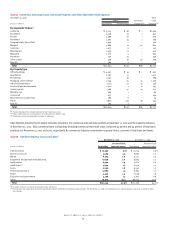
Commercial real estate – domestic loans totaled $22.3 billion and $26.2 billion at December 31, 2001 and 2000, respectively. Net charge-offs
were $39 million and $13 million for 2001 and 2000, respectively. Nonperforming commercial real estate – domestic loans were $240 million, or 1.08
percent of commercial real estate – domestic loans, at December 31, 2001, compared to $236 million, or 0.90 percent, at December 31, 2000. At
December 31, 2001, commercial real estate – domestic loans past due 90 days or more and still accruing interest were $40 million compared to
$16 million at December 31, 2000. Table Seventeen displays commercial real estate loans by geographic region and property type, including the portion
of such loans which are nonperforming and other real estate credit exposures.
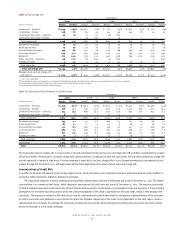
Table Eighteen presents aggregate commercial loan and lease exposures by certain significant industries.
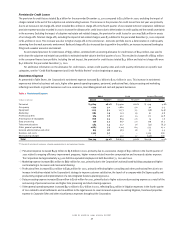
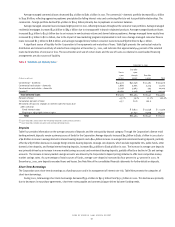
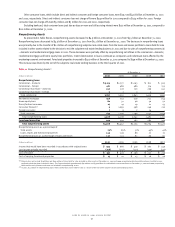
Consumer Portfolio
At December 31, 2001 and 2000, total consumer loans outstanding totaled $165.3 billion and $188.7 billion, respectively. Approximately 65 percent
and 70 percent of these loans were secured by first and second mortgages on residential real estate at December 31, 2001 and 2000, respectively.
In 1999, the Federal Financial Institutions Examination Council (FFIEC) issued the Uniform Classification and Account Management Policy (the Policy)
which provides guidance for and promotes consistency among banks on the charge-off treatment of delinquent and bankruptcy-related consumer loans.
The Corporation implemented the Policy in the fourth quarter of 2000, which resulted in accelerated charge-offs of $104 million across several product
types in the consumer loan portfolio.
Residential mortgage loans decreased to $78.2 billion at December 31, 2001 compared to $84.4 billion at December 31, 2000 as growth in retail
mortgage originations was more than offset by the impact of securitizations of $52.9 billion. Net charge-offs on residential mortgage loans were
$26 million for 2001. Nonperforming residential mortgage loans increased $5 million to $556 million at December 31, 2001.
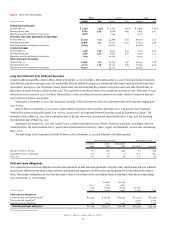
Home equity lines increased to $22.1 billion at December 31, 2001 compared to $21.6 billion at December 31, 2000. Net charge-offs on home
equity lines were $19 million and $20 million for 2001 and 2000, respectively. Nonperforming home equity lines increased to $80 million at December 31,
2001 compared to $32 million at December 31, 2000.
Consumer finance loans outstanding totaled $5.3 billion and $25.8 billion at December 31, 2001 and 2000, respectively. Consumer finance
nonperforming loans decreased to $9 million at December 31, 2001 compared to $1.1 billion at December 31, 2000. These decreases were due to the
transfer of approximately $21.4 billion of subprime real estate loans, of which $1.2 billion was nonperforming, to loans held for sale as a result of
the exit of the subprime real estate lending business in the third quarter of 2001. The Corporation had consumer finance net charge-offs of $929 million
for 2001 compared to $266 million for 2000. The increase in net charge-offs primarily reflected exit-related charge-offs of $635 million that were used
to write down the subprime real estate loan portfolio to estimated market value in the third quarter of 2001 and a weakened economic environment.
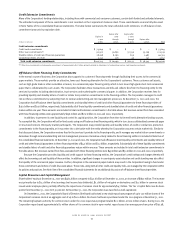
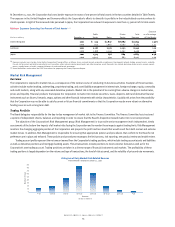
Bankcard receivables increased to $19.9 billion at December 31, 2001 compared to $14.1 billion at December 31, 2000. This increase was due to
new account growth and increased purchase volume on existing accounts. Net charge-offs on bankcard receivables for 2001 were $672 million
compared to $338 million for 2000. Managed bankcard net charge-offs increased $230 million to $1.2 billion, while the managed net charge-off ratio
increased 10 basis points to 4.76 percent for 2001. The increase in net charge-offs was primarily a result of growth in the portfolio outstandings, an
increase in personal bankruptcy filings and a weaker economic environment. Bankcard loans past due 90 days or more and still accruing interest were
$332 million at December 31, 2001 compared to $191 million at December 31, 2000.