Bank of America 2001 Annual Report Download - page 98
Download and view the complete annual report
Please find page 98 of the 2001 Bank of America annual report below. You can navigate through the pages in the report by either clicking on the pages listed below, or by using the keyword search tool below to find specific information within the annual report.-
 1
1 -
2
-
3
-
4
-
5
-
6
-
7
-
8
-
9
-
10
-
11
-
12
-
13
-
14
-
15
-
16
-
17
-
18
-
19
-
20
-
21
-
22
-
23
-
24
-
25
-
26
-
27
-
28
-
29
-
30
-
31
-
32
-
33
-
34
-
35
-
36
-
37
-
38
-
39
-
40
-
41
-
42
-
43
-
44
-
45
-
46
-
47
-
48
-
49
-
50
-
51
-
52
-
53
-
54
-
55
-
56
-
57
-
58
-
59
-
60
-
61
-
62
-
63
-
64
-
65
-
66
-
67
-
68
-
69
-
70
-
71
-
72
-
73
-
74
-
75
-
76
-
77
-
78
-
79
-
80
-
81
-
82
-
83
-
84
-
85
-
86
-
87
-
 88
88 -
 89
89 -
 90
90 -
 91
91 -
 92
92 -
 93
93 -
 94
94 -
 95
95 -
 96
96 -
 97
97 -
 98
98 -
 99
99 -
 100
100 -
 101
101 -
 102
102 -
 103
103 -
 104
104 -
 105
105 -
 106
106 -
 107
107 -
 108
108 -
109
-
110
-
111
-
112
-
113
-
114
-
115
-
116
-
117
-
118
-
119
-
120
-
121
-
122
-
123
-
124
 |
 |

BANK OF AMERICA 2001 ANNUAL REPORT
96
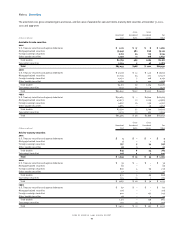
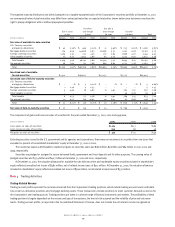
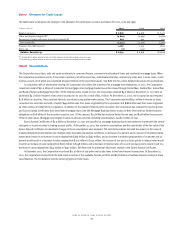
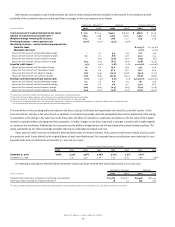
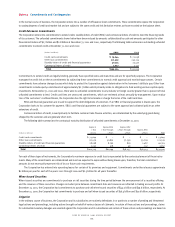
Key economic assumptions used in measuring the fair value of certain residual interests (included in other assets) in securitizations and the
sensitivity of the current fair value of residual cash flows to changes in those assumptions are as follows:
Commercial – Domestic
(1)
Bankcard Consumer Finance
(2)
(Dollars in millions)
2001 2000 2001 2000 2001 2000
Carrying amount of residual interests (at fair value) $ 77.9 $ 113.4 $ 146.1 $ 183.8 $468.6 $717.6
Balance of unamortized securitized loans(3) 1,954 2,198 7,302 8,736 5,347 7,167
Weighted-average remaining life (in years)0.22 1.74 1.88 2.27 3.25 3.29
Revolving structures – annual payment rate 30.0% 25.0% 14.4% 14.8%
Amortizing structures – annual constant prepayment rate:
Fixed rate loans 8.1-24.5% 8.7-25.0%
Adjustable rate loans 27.0% 32.0%
Impact on fair value of 100 bps favorable change –0.1 4.4 5.6 15.2 9.9
Impact on fair value of 200 bps favorable change 0.1 0.2 8.8 11.8 33.0 21.4
Impact on fair value of 100 bps adverse change –(0.1) (3.3) (4.7) (11.3) (8.1)
Impact on fair value of 200 bps adverse change (0.1) (0.2) (6.7) (9.3) (17.8) (14.5)
Expected credit losses(4) 1.5% 0.5% 7.8% 6.1% 1.2-10.0% 1.1-10.6%
Impact on fair value of 10% favorable change 7.0 0.4 15.0 13.8 41.5 23.6
Impact on fair value of 25% favorable change 7.9 0.9 37.3 34.5 119.7 59.4
Impact on fair value of 10% adverse change (7.0) (0.4) (15.0) (13.8) (34.7) (23.1)
Impact on fair value of 25% adverse change (7.9) (0.9) (37.3) (34.5) (76.9) (56.9)
Residual cash flows discount rate (annual rate) 6.0% 7.5% 6.0% 7.5% 15.0-30.0% 13.9-16.0%
Impact on fair value of 100 bps favorable change 0.2 0.4 0.3 0.4 16.1 13.9
Impact on fair value of 200 bps favorable change 0.4 0.7 0.6 0.7 33.0 28.7
Impact on fair value of 100 bps adverse change (0.2) (0.4) (0.3) (0.4) (15.0) (13.0)
Impact on fair value of 200 bps adverse change (0.4) (0.7) (0.6) (0.7) (29.2) (25.3)
(1) Commercial – domestic includes the Corporation’s 1997 securitization of commercial loans.
(2) Consumer finance includes subprime real estate loan and manufactured housing loan securitizations.
(3) Balances represent securitized loans that were off-balance sheet at December 31, 2001 and 2000.
(4) Annual rates of expected credit losses are presented for commercial – domestic and bankcard securitizations. Cumulative lifetime rates of expected credit
losses (incurred plus projected) are presented for the consumer finance loans.
The sensitivities in the preceding table and related to the Excess Spread Certificates are hypothetical and should be used with caution. As the
amounts indicate, changes in fair value based on variations in assumptions generally cannot be extrapolated because the relationship of the change
in assumption to the change in fair value may not be linear. Also, the effect of a variation in a particular assumption on the fair value of the retained
interest is calculated without changing any other assumption. In reality, changes in one factor may result in changes in another, which might magnify
or counteract the sensitivities. Additionally, the Corporation has the ability to hedge interest rate risk associated with retained residual positions. The
above sensitivities do not reflect any hedge strategies that may be undertaken to mitigate such risk.
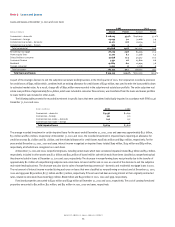
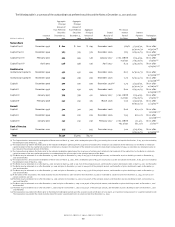
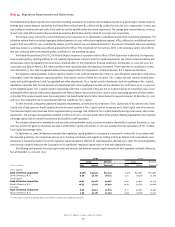
Static pool net credit losses are considered in determining the value of retained interests. Static pool net credit losses include actual incurred
plus projected credit losses divided by the original balance of each securitization pool. No consumer finance securitizations were transacted in 2000.
Expected static pool net credit losses at December 31, 2001 and 2000 were:
Year of Consumer Finance Loan Securitization
2001 1999 1998 1997
1996 1995 1994 1993
December 31, 2001 6.86% 4.93% 5.06% 3.68% 3.27% 4.15% 1.60%
December 31, 2000 4.12 4.47 3.78 3.34 3.75 1.96 1.18%
For revolving securitizations, the table below summarizes certain cash flows received from securitization trusts in 2001 and 2000:
Commercial – Domestic Bankcard
(Dollars in millions)
2001 2000 2001 2000
Proceeds from collections reinvested in revolving securitizations $15,789 $19,732 $19,418 $21,247
Other cash flows received on retained interests(1) 18 53 605 767
(1) Other cash flows represents amounts received on retained interests by the transferor other than servicing fees (e.g., cash flows from interest-only strips).