Bank of America 2001 Annual Report Download - page 83
Download and view the complete annual report
Please find page 83 of the 2001 Bank of America annual report below. You can navigate through the pages in the report by either clicking on the pages listed below, or by using the keyword search tool below to find specific information within the annual report.-
 1
1 -
2
-
3
-
4
-
5
-
6
-
7
-
8
-
9
-
10
-
11
-
12
-
13
-
14
-
15
-
16
-
17
-
18
-
19
-
20
-
21
-
22
-
23
-
24
-
25
-
26
-
27
-
28
-
29
-
30
-
31
-
32
-
33
-
34
-
35
-
36
-
37
-
38
-
39
-
40
-
41
-
42
-
43
-
44
-
45
-
46
-
47
-
48
-
49
-
50
-
51
-
52
-
53
-
54
-
55
-
56
-
57
-
58
-
59
-
60
-
61
-
62
-
63
-
64
-
65
-
66
-
67
-
68
-
69
-
70
-
71
-
72
-
 73
73 -
 74
74 -
 75
75 -
 76
76 -
 77
77 -
 78
78 -
 79
79 -
 80
80 -
 81
81 -
 82
82 -
 83
83 -
 84
84 -
 85
85 -
 86
86 -
 87
87 -
 88
88 -
 89
89 -
 90
90 -
 91
91 -
 92
92 -
 93
93 -
94
-
95
-
96
-
97
-
98
-
99
-
100
-
101
-
102
-
103
-
104
-
105
-
106
-
107
-
108
-
109
-
110
-
111
-
112
-
113
-
114
-
115
-
116
-
117
-
118
-
119
-
120
-
121
-
122
-
123
-
124
 |
 |

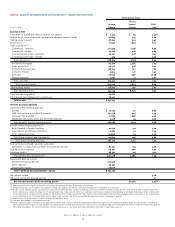
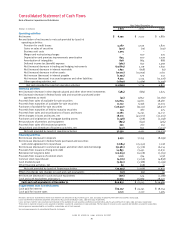
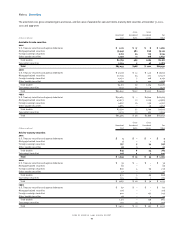
Consolidated Statement of Cash Flows
Bank of America Corporation and Subsidiaries
Year Ended December 31
(Dollars in millions)
2001 2000 1999
Operating activities
Net income $ 6,792 $ 7,517 $ 7,882
Reconciliation of net income to net cash provided by (used in)
operating activities:
Provision for credit losses 4,287 2,535 1,820
Gains on sales of securities (475) (25) (240)
Business exit costs 1,305 ––
Merger and restructuring charges –550 525
Depreciation and premises improvements amortization 854 920 1,029
Amortization of intangibles 878 864 888
Deferred income tax (benefit) expense (563) 647 2,459
Net (increase) decrease in trading and hedging instruments (19,865) 2,119 7,640
Net (increase) decrease in interest receivable 1,632 (658) (51)
Net (increase) decrease in other assets (10,911) (10,055) 2,611
Net increase (decrease) in interest payable (1,254) 575 332
Net increase (decrease) in accrued expenses and other liabilities 6,323 1,234 (13,326)
Other operating activities, net (1,829) (2,489) (1,746)
Net cash provided by (used in) operating activities (12,826) 3,734 9,823
Investing activities
Net (increase) decrease in time deposits placed and other short-term investments (484) (685) 1,625
Net (increase) decrease in federal funds sold and securities purchased under
agreements to resell (53) 9,857 (10,782)
Proceeds from sales of available-for-sale securities 125,824 34,671 38,587
Proceeds from maturities of available-for-sale securities 11,722 6,396 10,003
Purchases of available-for-sale securities (126,537) (19,132) (48,917)
Proceeds from maturities of held-to-maturity securities 145 380 575
Proceeds from sales and securitizations of loans and leases 10,781 15,751 15,717
Other changes in loans and leases, net 18,201 (43,070) (32,302)
Purchases and originations of mortgage banking assets (1,148) (208) (2,258)
Net purchases of premises and equipment (835) (642) (465)
Proceeds from sales of foreclosed properties 353 260 350
(Acquisition) and divestiture of business activities, net (417) 843 (1,212)
Net cash provided by (used in) investing activities 37,552 4,421 (29,079)
Financing activities
Net increase (decrease) in deposits 9,251 17,155 (8,299)
Net increase (decrease) in federal funds purchased and securities
sold under agreements to repurchase (1,684) (25,150) 7,018
Net increase (decrease) in commercial paper and other short-term borrowings (19,981) (5,376) 16,214
Proceeds from issuance of long-term debt 14,853 23,451 17,630
Retirement of long-term debt (20,619) (11,078) (7,763)
Proceeds from issuance of common stock 1,121 294 1,158
Common stock repurchased (4,716) (3,256) (4,858)
Cash dividends paid (3,632) (3,388) (3,199)
Other financing activities, net 62 (218) 12
Net cash provided by (used in) financing activities (25,345) (7,566) 17,913
Effect of exchange rate changes on cash and cash equivalents (57) (65) 55
Net increase (decrease) in cash and cash equivalents (676) 524 (1,288)
Cash and cash equivalents at January 1 27,513 26,989 28,277
Cash and cash equivalents at December 31 $26,837 $ 27,513 $ 26,989
Supplemental cash flow disclosures
Cash paid for interest $19,257 $ 24,241 $ 18,754
Cash paid for income taxes 3,121 2,130 1,595
Net loans and leases transferred to (from) loans held for sale amounted to $428 and $(247) in 2001 and 2000, respectively. There were no transfers during 1999.
Loans transferred to foreclosed properties amounted to $533, $380 and $305 in 2001, 2000 and 1999, respectively.
Loans and loans held for sale securitized and retained in the available-for-sale securities portfolio amounted to $29,985, $2,483 and $6,682 in 2001, 2000 and 1999, respectively.
There were no material noncash assets acquired or liabilities assumed in acquisitions in 2001 and 2000. The fair value of noncash assets acquired and liabilities assumed in acquisitions
during 1999 was approximately $1,557 and $74, respectively, net of cash acquired.
See accompanying notes to consolidated financial statements.
BANK OF AMERICA 2001 ANNUAL REPORT
81