Bank of America 2001 Annual Report Download - page 76
Download and view the complete annual report
Please find page 76 of the 2001 Bank of America annual report below. You can navigate through the pages in the report by either clicking on the pages listed below, or by using the keyword search tool below to find specific information within the annual report.-
 1
1 -
2
-
3
-
4
-
5
-
6
-
7
-
8
-
9
-
10
-
11
-
12
-
13
-
14
-
15
-
16
-
17
-
18
-
19
-
20
-
21
-
22
-
23
-
24
-
25
-
26
-
27
-
28
-
29
-
30
-
31
-
32
-
33
-
34
-
35
-
36
-
37
-
38
-
39
-
40
-
41
-
42
-
43
-
44
-
45
-
46
-
47
-
48
-
49
-
50
-
51
-
52
-
53
-
54
-
55
-
56
-
57
-
58
-
59
-
60
-
61
-
62
-
63
-
64
-
65
-
 66
66 -
 67
67 -
 68
68 -
 69
69 -
 70
70 -
 71
71 -
 72
72 -
 73
73 -
 74
74 -
 75
75 -
 76
76 -
 77
77 -
 78
78 -
 79
79 -
 80
80 -
 81
81 -
 82
82 -
 83
83 -
 84
84 -
 85
85 -
 86
86 -
87
-
88
-
89
-
90
-
91
-
92
-
93
-
94
-
95
-
96
-
97
-
98
-
99
-
100
-
101
-
102
-
103
-
104
-
105
-
106
-
107
-
108
-
109
-
110
-
111
-
112
-
113
-
114
-
115
-
116
-
117
-
118
-
119
-
120
-
121
-
122
-
123
-
124
 |
 |

BANK OF AMERICA 2001 ANNUAL REPORT
74
2000 Compared to 1999
The following discussion and analysis provides a comparison of the Corporation’s results of operations for the years ended December 31, 2000 and
1999. This discussion should be read in conjunction with the consolidated financial statements and related notes on pages 78 through 119.
Overview
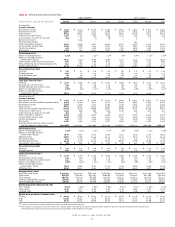
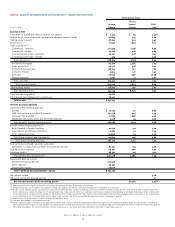
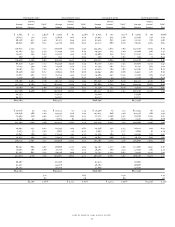
Net income totaled $7.5 billion, or $4.52 per common share (diluted), in 2000 compared to $7.9 billion, or $4.48 per common share (diluted), in 1999.
The return on average common shareholders’ equity was 15.96 percent, a decrease of 97 basis points.
The Corporation’s operating earnings, which excluded merger and restructuring charges, totaled $7.9 billion, or $4.72 per common share (diluted),
in 2000 compared to $8.2 billion, or $4.68 per common share (diluted) in 1999. Excluding merger and restructuring charges, the return on average
common shareholders’ equity decreased 100 basis points to 16.70 percent in 2000. SVA, excluding merger and restructuring charges, decreased
$463 million to $3.1 billion in 2000.
Business Segment Operations
Consumer and Commercial Banking
Revenue remained essentially unchanged at $20.0 billion, as growth in noninterest income was offset by a decline in net interest income. Net interest
income declined $231 million, or two percent, to $12.6 billion as loan growth was offset by spread compression. Strong card income growth and higher
service charges were partially offset by lower mortgage banking income, resulting in a $196 million, or three percent, increase in noninterest income.
Cash basis earnings remained essentially flat at $5.2 billion. SVA increased $121 million, or four percent, driven by the decline in the cost of capital.
Asset Management
Revenue increased $190 million, or eight percent, driven by increases in both net interest income and noninterest income. Net interest income increased
$56 million, or nine percent, due to strong loan growth in the commercial loan portfolio. The $134 million, or eight percent, increase in noninterest
income was primarily due to increased investment and brokerage fees driven by new asset management business and market growth combined with
productivity increases in consumer brokerage, partially offset by gains in 1999 on the disposition of certain businesses. Cash basis earnings increased
$109 million, or 21 percent, primarily driven by higher revenue. SVA increased $110 million, or 35 percent, driven by the increase in cash basis earnings.
Global Corporate and Investment Banking
Revenue increased $658 million, or nine percent, driven by increases in both net interest income and noninterest income. Net interest income increased
$318 million, or nine percent, as a result of higher trading-related activities and increases in the commercial – domestic loan portfolio. The $340 million,
or eight percent, increase in noninterest income was due to continued growth in equities and equity derivatives trading, equity underwriting and advisory
services. Cash basis earnings decreased $163 million, or eight percent, as the increase in revenue was more than offset by increases in the provision
for credit losses and noninterest expense. The provision for credit losses increased $538 million due to credit quality deterioration in the commercial
– domestic loan portfolio. Noninterest expense increased $357 million, or eight percent, primarily from higher revenue-related incentive compensa-
tion and costs related to the rationalization of operations in Colombia and Venezuela. SVA declined $182 million, or 35 percent, primarily driven by the
decline in cash basis earnings.
Equity Investments
Revenue increased $174 million, or 25 percent, as the increase in noninterest income more than offset the decrease in net interest income. Net interest
income, which primarily consists of the funding cost associated with the carrying value of investments, decreased $56 million. Equity investment
gains increased $247 million to $993 million, with $832 million in Principal Investing and $161 million in the strategic investments portfolio. Cash basis
earnings increased $130 million as a result of the increase in revenue. SVA increased $71 million, as the increase in cash basis earnings was partially
offset by an increase in the cost of capital.
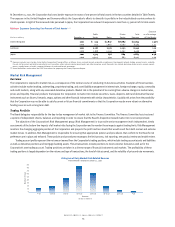
Net Interest Income
Net interest income on a taxable-equivalent basis increased $329 million to $18.7 billion. Managed loan growth, particularly in consumer products,
and higher levels of customer-based deposits and equity were partially offset by spread compression, the cost of share repurchases and a decrease
in auto lease financing contributions.
The net interest yield decreased 25 basis points to 3.20 percent in 2000 compared to 3.45 percent in 1999, mainly due to spread compression,
the cost of share repurchases and deterioration in auto lease residual values.
Noninterest Income
Noninterest income increased three percent to $14.6 billion in 2000 compared to $14.2 billion in 1999, primarily reflecting higher levels of trading
account profits, card income, equity investment gains, service charges, investment and brokerage services and investment banking income, partially
offset by declines in other income and mortgage banking income.