RBS 2004 Annual Report Download - page 100
Download and view the complete annual report
Please find page 100 of the 2004 RBS annual report below. You can navigate through the pages in the report by either clicking on the pages listed below, or by using the keyword search tool below to find specific information within the annual report.-
 1
1 -
2
-
3
-
4
-
5
-
6
-
7
-
8
-
9
-
10
-
11
-
12
-
13
-
14
-
15
-
16
-
17
-
18
-
19
-
20
-
21
-
22
-
23
-
24
-
25
-
26
-
27
-
28
-
29
-
30
-
31
-
32
-
33
-
34
-
35
-
36
-
37
-
38
-
39
-
40
-
41
-
42
-
43
-
44
-
45
-
46
-
47
-
48
-
49
-
50
-
51
-
52
-
53
-
54
-
55
-
56
-
57
-
58
-
59
-
60
-
61
-
62
-
63
-
64
-
65
-
66
-
67
-
68
-
69
-
70
-
71
-
72
-
73
-
74
-
75
-
76
-
77
-
78
-
79
-
80
-
81
-
82
-
83
-
84
-
85
-
86
-
87
-
88
-
89
-
 90
90 -
 91
91 -
 92
92 -
 93
93 -
 94
94 -
 95
95 -
 96
96 -
 97
97 -
 98
98 -
 99
99 -
 100
100 -
 101
101 -
 102
102 -
 103
103 -
 104
104 -
 105
105 -
 106
106 -
 107
107 -
 108
108 -
 109
109 -
 110
110 -
111
-
112
-
113
-
114
-
115
-
116
-
117
-
118
-
119
-
120
-
121
-
122
-
123
-
124
-
125
-
126
-
127
-
128
-
129
-
130
-
131
-
132
-
133
-
134
-
135
-
136
-
137
-
138
-
139
-
140
-
141
-
142
-
143
-
144
-
145
-
146
-
147
-
148
-
149
-
150
-
151
-
152
-
153
-
154
-
155
-
156
-
157
-
158
-
159
-
160
-
161
-
162
-
163
-
164
-
165
-
166
-
167
-
168
-
169
-
170
-
171
-
172
-
173
-
174
-
175
-
176
-
177
-
178
-
179
-
180
-
181
-
182
-
183
-
184
-
185
-
186
-
187
-
188
-
189
-
190
-
191
-
192
-
193
-
194
-
195
-
196
-
197
-
198
-
199
-
200
-
201
-
202
-
203
-
204
-
205
-
206
-
207
-
208
-
209
-
210
-
211
-
212
-
213
-
214
-
215
-
216
-
217
-
218
-
219
-
220
-
221
-
222
-
223
-
224
-
225
-
226
-
227
-
228
-
229
-
230
-
231
-
232
-
233
-
234
 |
 |
98
Operating and financial review
Operating and financial review continued
Credit risk (continued)
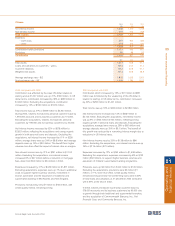
Risk asset quality
Internal reporting and oversight of risk assets is principally
differentiated by credit ratings. Internal ratings are used to
assess the credit quality of borrowers. Customers are assigned
credit ratings, based on statistical and judgemental rating
systems that map to a Group asset quality scale reflecting the
probability of default. Over the past year, RBS has made
significant strides in updating its credit grading models to take
account of the new Basel Capital Accord (see page 219).
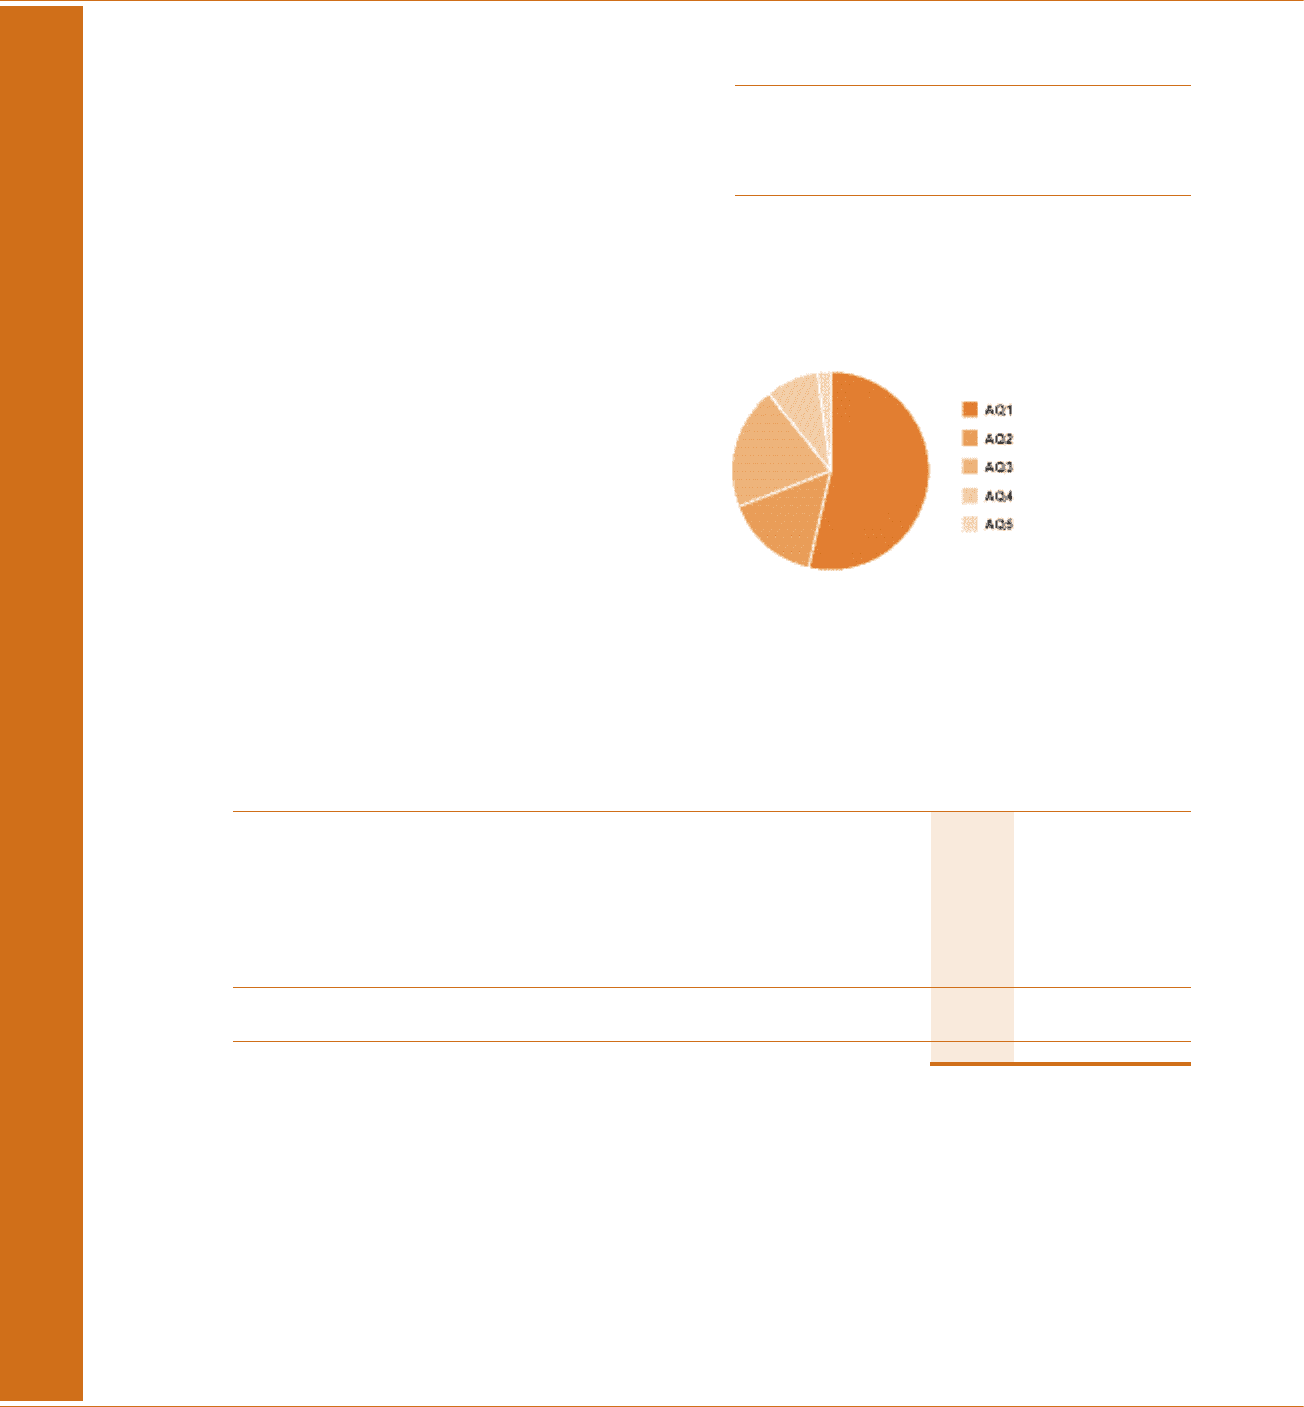
As at December 2004, exposure to investment grade
counterparties (AQ1) accounted for over half of risk assets. Over
97% of exposures were to counterparties rated AQ4 or higher.
Asset quality S&P equivalent
AQ1 AAA to BBB-
AQ2 BB+ to BB
AQ3 BB- to B+
AQ4 B+ to B
AQ5 B and below
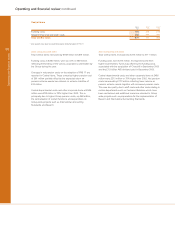
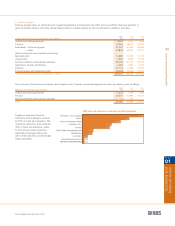
2004 2003 2002
Loans and advances – gross £m £m £m
Loans and advances to customers by division – gross
CBFM 176,690 128,124 117,365
Retail Banking 72,197 61,809 55,619
Retail Direct 25,206 22,024 19,350
Wealth Management 9,221 7,894 7,267
Ulster Bank 21,659 11,633 9,111
Citizens 43,104 24,384 19,457
Other 1,614 585 (925)
Loans and advances to customers – gross 349,691 256,453 227,244
Loans and advances to banks – gross 58,266 51,898 44,303
Total loans and advances – gross 407,957 308,351 271,547
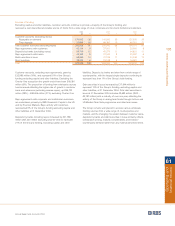
Loans and advances
The Group’s loan portfolio consists of loans (including overdraft facilities), instalment credit and finance lease receivables. The value
of loans and advances to customers at 31 December 2004 was £349,691 million (2003 – £256,453 million), representing an increase of
£93,238 million (36%) over the year, of which £23,468 million relates to the largest three acquisitions (Charter One, First Active &
Peoples Bank Cards) and £28,115 million relates to growth in reverse repo activity. Including banks, total loans and advances at
31 December 2004 was £407,957 million (2003 – £308,351 million), an increase of 32%.
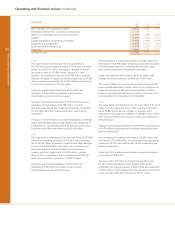
Distribution of risk assets by asset quality