RBS 2004 Annual Report Download - page 84
Download and view the complete annual report
Please find page 84 of the 2004 RBS annual report below. You can navigate through the pages in the report by either clicking on the pages listed below, or by using the keyword search tool below to find specific information within the annual report.-
 1
1 -
2
-
3
-
4
-
5
-
6
-
7
-
8
-
9
-
10
-
11
-
12
-
13
-
14
-
15
-
16
-
17
-
18
-
19
-
20
-
21
-
22
-
23
-
24
-
25
-
26
-
27
-
28
-
29
-
30
-
31
-
32
-
33
-
34
-
35
-
36
-
37
-
38
-
39
-
40
-
41
-
42
-
43
-
44
-
45
-
46
-
47
-
48
-
49
-
50
-
51
-
52
-
53
-
54
-
55
-
56
-
57
-
58
-
59
-
60
-
61
-
62
-
63
-
64
-
65
-
66
-
67
-
68
-
69
-
70
-
71
-
72
-
73
-
 74
74 -
 75
75 -
 76
76 -
 77
77 -
 78
78 -
 79
79 -
 80
80 -
 81
81 -
 82
82 -
 83
83 -
 84
84 -
 85
85 -
 86
86 -
 87
87 -
 88
88 -
 89
89 -
 90
90 -
 91
91 -
 92
92 -
 93
93 -
 94
94 -
95
-
96
-
97
-
98
-
99
-
100
-
101
-
102
-
103
-
104
-
105
-
106
-
107
-
108
-
109
-
110
-
111
-
112
-
113
-
114
-
115
-
116
-
117
-
118
-
119
-
120
-
121
-
122
-
123
-
124
-
125
-
126
-
127
-
128
-
129
-
130
-
131
-
132
-
133
-
134
-
135
-
136
-
137
-
138
-
139
-
140
-
141
-
142
-
143
-
144
-
145
-
146
-
147
-
148
-
149
-
150
-
151
-
152
-
153
-
154
-
155
-
156
-
157
-
158
-
159
-
160
-
161
-
162
-
163
-
164
-
165
-
166
-
167
-
168
-
169
-
170
-
171
-
172
-
173
-
174
-
175
-
176
-
177
-
178
-
179
-
180
-
181
-
182
-
183
-
184
-
185
-
186
-
187
-
188
-
189
-
190
-
191
-
192
-
193
-
194
-
195
-
196
-
197
-
198
-
199
-
200
-
201
-
202
-
203
-
204
-
205
-
206
-
207
-
208
-
209
-
210
-
211
-
212
-
213
-
214
-
215
-
216
-
217
-
218
-
219
-
220
-
221
-
222
-
223
-
224
-
225
-
226
-
227
-
228
-
229
-
230
-
231
-
232
-
233
-
234
 |
 |

82
Operating and financial review
Operating and financial review continued
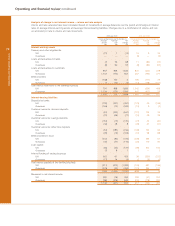
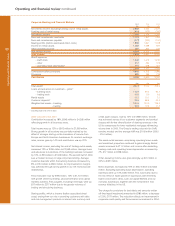
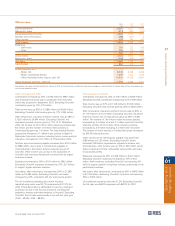
Retail Banking
2004 2003* 2002*
£m £m £m
Net interest income 3,112 2,959 2,849
Non-interest income 1,630 1,514 1,430
Total income 4,742 4,473 4,279
Direct expenses
– staff costs 834 793 729
– other 240 237 263
1,074 1,030 992
Contribution before provisions 3,668 3,443 3,287
Provisions 389 273 213
Contribution 3,279 3,170 3,074
£bn £bn £bn
Total banking assets 74.2 63.9 57.4
Loans and advances to customers – gross
– mortgages 44.1 36.6 32.1
– small business 15.2 13.8 12.5
– consumer lending 12.9 11.4 11.0
Customer deposits 70.6 66.5 61.9
Weighted risk assets 49.7 42.9 38.8
* prior periods have been restated to reflect the transfer in 2004 of certain activities from Wealth Management.
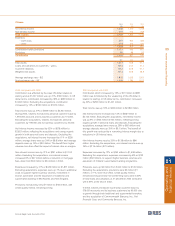
2004 compared with 2003
The division continued to achieve strong volume growth across
all key product areas – in particular mortgages, loans and
savings – supported by increased customer numbers. As a
result, income increased by 6% or £269 million to £4,742 million,
and contribution by 3% or £109 million to £3,279 million.
Net interest income rose by 5% or £153 million to £3,112
million, reflecting strong growth in lending and deposits which
more than offset the impact of business mix – particularly
strong growth in low risk mortgage lending – and the impact of
lower margin in some areas, especially unsecured lending.
Average loans to customers, excluding mortgages, grew by
12% or £2.8 billion to £26.5 billion. Average mortgage lending
grew by 21% or £7.0 billion to £40.7 billion. Both mortgage and
non-mortgage lending have evidenced a slowdown in growth
in the second half of the year. Average customer deposits
increased by 8% or £4.9 billion to £66.0 billion.
Non-interest income rose by 8% or £116 million to £1,630
million. This reflected higher fee income associated with strong
asset growth in both personal and business sectors together
with increased volumes of money transmission activity.
Direct expenses increased by 4% or £44 million to £1,074
million. Staff expenses increased 5% or £41 million to £834
million, principally due to the deployment of an additional one
thousand customer facing staff in the NatWest network. The
increase in other expenses was 1% or £3 million, reflecting
rigorous cost management.
The charge for provisions for bad and doubtful debts increased
by £116 million to £389 million. The increased charge reflects
the anticipated increase in delinquency rates in the NatWest
portfolio following growth in unsecured lending in recent years.
NatWest credit experience is now broadly consistent with the
RBS portfolio which has been stable for a number of years. As
reported in the first half, there has also been a higher incidence
of fraud which has led to some deterioration in recovery rates.
The overall quality of the loan portfolio, the majority of which is
mortgage lending, as measured by probability of default,
remained in line with expectations.