RBS 2004 Annual Report Download - page 4
Download and view the complete annual report
Please find page 4 of the 2004 RBS annual report below. You can navigate through the pages in the report by either clicking on the pages listed below, or by using the keyword search tool below to find specific information within the annual report.-
 1
1 -
 2
2 -
 3
3 -
 4
4 -
 5
5 -
 6
6 -
 7
7 -
 8
8 -
 9
9 -
 10
10 -
 11
11 -
 12
12 -
 13
13 -
 14
14 -
 15
15 -
16
-
17
-
18
-
19
-
20
-
21
-
22
-
23
-
24
-
25
-
26
-
27
-
28
-
29
-
30
-
31
-
32
-
33
-
34
-
35
-
36
-
37
-
38
-
39
-
40
-
41
-
42
-
43
-
44
-
45
-
46
-
47
-
48
-
49
-
50
-
51
-
52
-
53
-
54
-
55
-
56
-
57
-
58
-
59
-
60
-
61
-
62
-
63
-
64
-
65
-
66
-
67
-
68
-
69
-
70
-
71
-
72
-
73
-
74
-
75
-
76
-
77
-
78
-
79
-
80
-
81
-
82
-
83
-
84
-
85
-
86
-
87
-
88
-
89
-
90
-
91
-
92
-
93
-
94
-
95
-
96
-
97
-
98
-
99
-
100
-
101
-
102
-
103
-
104
-
105
-
106
-
107
-
108
-
109
-
110
-
111
-
112
-
113
-
114
-
115
-
116
-
117
-
118
-
119
-
120
-
121
-
122
-
123
-
124
-
125
-
126
-
127
-
128
-
129
-
130
-
131
-
132
-
133
-
134
-
135
-
136
-
137
-
138
-
139
-
140
-
141
-
142
-
143
-
144
-
145
-
146
-
147
-
148
-
149
-
150
-
151
-
152
-
153
-
154
-
155
-
156
-
157
-
158
-
159
-
160
-
161
-
162
-
163
-
164
-
165
-
166
-
167
-
168
-
169
-
170
-
171
-
172
-
173
-
174
-
175
-
176
-
177
-
178
-
179
-
180
-
181
-
182
-
183
-
184
-
185
-
186
-
187
-
188
-
189
-
190
-
191
-
192
-
193
-
194
-
195
-
196
-
197
-
198
-
199
-
200
-
201
-
202
-
203
-
204
-
205
-
206
-
207
-
208
-
209
-
210
-
211
-
212
-
213
-
214
-
215
-
216
-
217
-
218
-
219
-
220
-
221
-
222
-
223
-
224
-
225
-
226
-
227
-
228
-
229
-
230
-
231
-
232
-
233
-
234
 |
 |

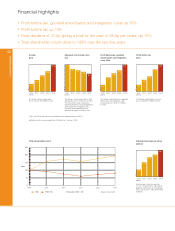
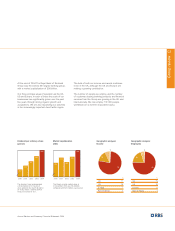
Financial highlights
Financial highlights
0
50
100
150
200
250
FTSE 100RBS
1999 20042003
31 December 1999 = 100 Source: Datastream
200220012000
Index
Total shareholder return Adjusted earnings per share
(pence)
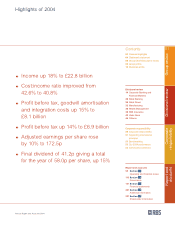
The Group’s total income grew
by 18% to £22,754 million in 2004.
The Group’s profit before tax, goodwill
amortisation and integration costs
increased by 15% to £8,101 million
in 2004.
The Group’s profit before tax, rose
by 14% to £6,917 million in 2004.
Profit before tax
(£m)
2000
proforma
2001 2002* 2003* 2004
4,252
3,327
4,852
6,076
6,917
2000
proforma
2001 2002* 2003* 2004
5,778
4,401
6,540
7,068
8,101
2000
proforma
2001 2002* 2003* 2004
45.3
51.9
44.2
42.6
40.8
2000
proforma
2001 2002* 2003* 2004
14,558
12,358
17,016
19,281
22,754
2000
proforma
2001 2002* 2003* 2004
127.9
101.8
146.3
157.2
172.5
Income
(£m)
Adjusted cost:income ratio
(%)
Profit before tax, goodwill
amortisation and integration
costs (£m)
Earnings per share increased by
10% to 172.5p for 2004, adjusted for
goodwill amortisation and integration
costs, and in 2001 – 2003 for the AVS
dividend.
The Group’s cost:income ratio in 2004
improved to 40.8% from 42.6% in 2003.
The cost:income ratio is based on
operating expenses excluding goodwill
amortisation and integration costs,
and after netting operating lease
depreciation against rental income.
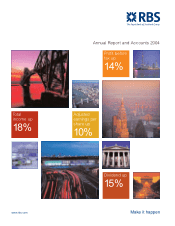
Profit before tax, goodwill amortisation and integration costs up 15%
Profit before tax up 14%
Final dividend of 41.2p giving a total for the year of 58.0p per share, up 15%
Total shareholder return close to 100% over the last five years
02
*2002 and 2003 have been restated following the implementation of FRS 17.
proforma results assume acquisition of NatWest on 1 January 2000.