RBS 2004 Annual Report Download - page 156
Download and view the complete annual report
Please find page 156 of the 2004 RBS annual report below. You can navigate through the pages in the report by either clicking on the pages listed below, or by using the keyword search tool below to find specific information within the annual report.-
 1
1 -
2
-
3
-
4
-
5
-
6
-
7
-
8
-
9
-
10
-
11
-
12
-
13
-
14
-
15
-
16
-
17
-
18
-
19
-
20
-
21
-
22
-
23
-
24
-
25
-
26
-
27
-
28
-
29
-
30
-
31
-
32
-
33
-
34
-
35
-
36
-
37
-
38
-
39
-
40
-
41
-
42
-
43
-
44
-
45
-
46
-
47
-
48
-
49
-
50
-
51
-
52
-
53
-
54
-
55
-
56
-
57
-
58
-
59
-
60
-
61
-
62
-
63
-
64
-
65
-
66
-
67
-
68
-
69
-
70
-
71
-
72
-
73
-
74
-
75
-
76
-
77
-
78
-
79
-
80
-
81
-
82
-
83
-
84
-
85
-
86
-
87
-
88
-
89
-
90
-
91
-
92
-
93
-
94
-
95
-
96
-
97
-
98
-
99
-
100
-
101
-
102
-
103
-
104
-
105
-
106
-
107
-
108
-
109
-
110
-
111
-
112
-
113
-
114
-
115
-
116
-
117
-
118
-
119
-
120
-
121
-
122
-
123
-
124
-
125
-
126
-
127
-
128
-
129
-
130
-
131
-
132
-
133
-
134
-
135
-
136
-
137
-
138
-
139
-
140
-
141
-
142
-
143
-
144
-
145
-
 146
146 -
 147
147 -
 148
148 -
 149
149 -
 150
150 -
 151
151 -
 152
152 -
 153
153 -
 154
154 -
 155
155 -
 156
156 -
 157
157 -
 158
158 -
 159
159 -
 160
160 -
 161
161 -
 162
162 -
 163
163 -
 164
164 -
 165
165 -
 166
166 -
167
-
168
-
169
-
170
-
171
-
172
-
173
-
174
-
175
-
176
-
177
-
178
-
179
-
180
-
181
-
182
-
183
-
184
-
185
-
186
-
187
-
188
-
189
-
190
-
191
-
192
-
193
-
194
-
195
-
196
-
197
-
198
-
199
-
200
-
201
-
202
-
203
-
204
-
205
-
206
-
207
-
208
-
209
-
210
-
211
-
212
-
213
-
214
-
215
-
216
-
217
-
218
-
219
-
220
-
221
-
222
-
223
-
224
-
225
-
226
-
227
-
228
-
229
-
230
-
231
-
232
-
233
-
234
 |
 |
154
Notes on the accounts
Notes on the accounts continued
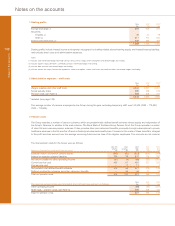
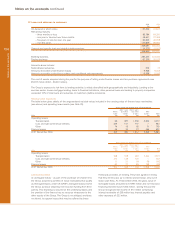
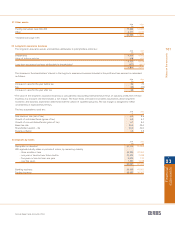
12 Loans and advances to customers
2004 2003
£m £m
On demand or short notice 51,234 24,847
Remaining maturity
– three months or less 89,784 64,281
– one year or less but over three months 38,461 27,465
– five years or less but over one year 53,543 40,908
– over five years 116,669 98,952
349,691 256,453
General and specific bad and doubtful debt provisions (4,222) (3,922)
345,469 252,531
Banking business 283,233 223,456
Trading business 62,236 29,075
Amounts above include:
Subordinated advances 220 73
Amounts receivable under finance leases 9,968 8,405
Amounts receivable under hire purchase and conditional sale agreements 6,358 5,935
The cost of assets acquired during the year for the purpose of letting under finance leases and hire purchase agreements was
£5,937 million (2003 – £6,361 million).
The Group’s exposure to risk from its lending activities is widely diversified both geographically and industrially. Lending to the
services sector, house mortgage lending, loans to financial institutions, other personal loans and lending to property companies
exceeded 10% of total loans and advances to customers (before provisions).
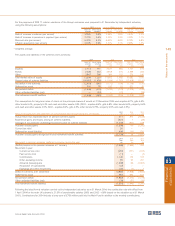
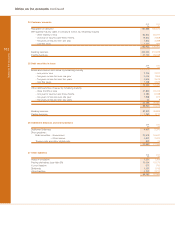
Residual value exposures
The table below gives details of the unguaranteed residual values included in the carrying value of finance lease receivables
(see above) and operating lease assets (see Note 20).
Year in which the residual value will be recovered
After 1 year After 2 years
Within but within but within After
1 year 2 years 5 years 5 years Total
2004 £m £m £m £m £m
Operating leases
Transportation 69 387 1,260 2,603 4,319
Cars and light commercial vehicles 405 141 117 — 663
Other 14 19 65 11 109
Finance leases 34 33 70 355 492
At 31 December 2004 522 580 1,512 2,969 5,583
Year in which the residual value will be recovered
After 1 year After 2 years
Within but within but within After
1 year 2 years 5 years 5 years Total
2003 £m £m £m £m £m
Operating leases
Transportation 548 198 481 2,344 3,571
Cars and light commercial vehicles 313 128 120 — 561
Other 11 21 54 96 182
Finance leases 62 21 85 158 326
At 31 December 2003 934 368 740 2,598 4,640
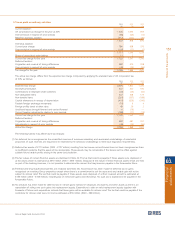
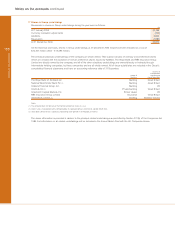
Linked presentation
(i) Leveraged leases – as part of the purchase of Charter One,
the Group acquired a portfolio of lease receivables that qualify
as leveraged leases under US GAAP. Leveraged leases involve
the Group as lessor obtaining non-recourse funding from third
parties. This financing is secured on the underlying leases and
the provider of the finance has no recourse whatsoever to the
other assets of the Group. The Group is not obliged, and does
not intend, to support losses that may be suffered by these
third-party providers of funding. They have agreed in writing
that they will be paid, as to interest and principal, only out of
lease cash flows. At 31 December 2004, the gross value of
leveraged leases amounted to £1,897 million and non-recourse
financing received was £1,502 million. During the year the
Group recognised net income of £13 million comprising
interest receivable of £35 million less interest payable and
other expenses of £22 million.