RBS 2004 Annual Report Download - page 204
Download and view the complete annual report
Please find page 204 of the 2004 RBS annual report below. You can navigate through the pages in the report by either clicking on the pages listed below, or by using the keyword search tool below to find specific information within the annual report.-
 1
1 -
2
-
3
-
4
-
5
-
6
-
7
-
8
-
9
-
10
-
11
-
12
-
13
-
14
-
15
-
16
-
17
-
18
-
19
-
20
-
21
-
22
-
23
-
24
-
25
-
26
-
27
-
28
-
29
-
30
-
31
-
32
-
33
-
34
-
35
-
36
-
37
-
38
-
39
-
40
-
41
-
42
-
43
-
44
-
45
-
46
-
47
-
48
-
49
-
50
-
51
-
52
-
53
-
54
-
55
-
56
-
57
-
58
-
59
-
60
-
61
-
62
-
63
-
64
-
65
-
66
-
67
-
68
-
69
-
70
-
71
-
72
-
73
-
74
-
75
-
76
-
77
-
78
-
79
-
80
-
81
-
82
-
83
-
84
-
85
-
86
-
87
-
88
-
89
-
90
-
91
-
92
-
93
-
94
-
95
-
96
-
97
-
98
-
99
-
100
-
101
-
102
-
103
-
104
-
105
-
106
-
107
-
108
-
109
-
110
-
111
-
112
-
113
-
114
-
115
-
116
-
117
-
118
-
119
-
120
-
121
-
122
-
123
-
124
-
125
-
126
-
127
-
128
-
129
-
130
-
131
-
132
-
133
-
134
-
135
-
136
-
137
-
138
-
139
-
140
-
141
-
142
-
143
-
144
-
145
-
146
-
147
-
148
-
149
-
150
-
151
-
152
-
153
-
154
-
155
-
156
-
157
-
158
-
159
-
160
-
161
-
162
-
163
-
164
-
165
-
166
-
167
-
168
-
169
-
170
-
171
-
172
-
173
-
174
-
175
-
176
-
177
-
178
-
179
-
180
-
181
-
182
-
183
-
184
-
185
-
186
-
187
-
188
-
189
-
190
-
191
-
192
-
193
-
 194
194 -
 195
195 -
 196
196 -
 197
197 -
 198
198 -
 199
199 -
 200
200 -
 201
201 -
 202
202 -
 203
203 -
 204
204 -
 205
205 -
 206
206 -
 207
207 -
 208
208 -
 209
209 -
 210
210 -
 211
211 -
 212
212 -
 213
213 -
 214
214 -
215
-
216
-
217
-
218
-
219
-
220
-
221
-
222
-
223
-
224
-
225
-
226
-
227
-
228
-
229
-
230
-
231
-
232
-
233
-
234
 |
 |

202
Additional information
Additional information
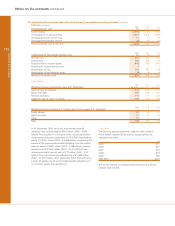
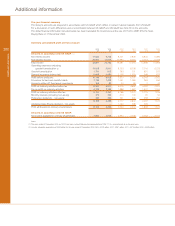
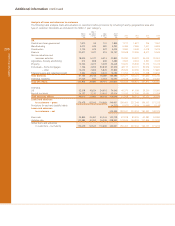
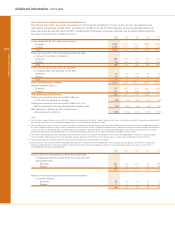
Five year financial summary
The Group’s accounts are prepared in accordance with UK GAAP, which differs in certain material respects from US GAAP.
For a discussion of such differences and a reconciliation between UK GAAP and US GAAP, see Note 53 on the accounts.
The dollar financial information included below has been translated for convenience at the rate of £1.00 to US$1.916, the Noon
Buying Rate on 31 December 2004.
Summary consolidated profit and loss account
2004 2004 2003 2002 2001 2000
$m £m £m £m £m £m
Amounts in accordance with UK GAAP (1):
Net interest income 17,643 9,208 8,301 7,849 6,846 5,286
Non-interest income 25,954 13,546 10,980 9,167 7,712 5,709
Total income 43,597 22,754 19,281 17,016 14,558 10,995
Operating expenses excluding
goodwill amortisation (2) 19,028 9,931 8,753 8,738 7,716 6,223
Goodwill amortisation 1,753 915 763 731 651 537
General insurance claims (net) 6,668 3,480 2,195 1,350 948 673
Profit before provisions 16,148 8,428 7,570 6,197 5,243 3,562
Provisions for bad and doubtful debts 2,736 1,428 1,461 1,286 984 550
Amounts written off fixed asset investments 159 83 33 59 7 42
Profit on ordinary activities before tax 13,253 6,917 6,076 4,852 4,252 2,970
Tax on profit on ordinary activities 4,129 2,155 1,888 1,582 1,537 1,054
Profit on ordinary activities after tax 9,124 4,762 4,188 3,270 2,715 1,916
Minority interests (including non-equity) 479 250 210 133 90 50
Preference dividends – non-equity 490 256 261 305 358 294
8,155 4,256 3,717 2,832 2,267 1,572
Additional Value Shares dividend – non-equity — — 1,463 798 399 —
Profit attributable to ordinary shareholders 8,155 4,256 2,254 2,034 1,868 1,572
Amounts in accordance with US GAAP:
Net income available for ordinary shareholders 7,564 3,948 2,564 3,108 2,062 2,102
Notes:
(1) The years ended 31 December 2003 and 2002 have been restated following the implementation of FRS 17. It is not practicable to restate prior years.
(2) Includes integration expenditure of £269 million for the year ended 31 December 2004 (2003 – £229 million; 2002 – £957 million; 2001 – £875 million; 2000 – £389 million).