RBS 2004 Annual Report Download - page 198
Download and view the complete annual report
Please find page 198 of the 2004 RBS annual report below. You can navigate through the pages in the report by either clicking on the pages listed below, or by using the keyword search tool below to find specific information within the annual report.-
 1
1 -
2
-
3
-
4
-
5
-
6
-
7
-
8
-
9
-
10
-
11
-
12
-
13
-
14
-
15
-
16
-
17
-
18
-
19
-
20
-
21
-
22
-
23
-
24
-
25
-
26
-
27
-
28
-
29
-
30
-
31
-
32
-
33
-
34
-
35
-
36
-
37
-
38
-
39
-
40
-
41
-
42
-
43
-
44
-
45
-
46
-
47
-
48
-
49
-
50
-
51
-
52
-
53
-
54
-
55
-
56
-
57
-
58
-
59
-
60
-
61
-
62
-
63
-
64
-
65
-
66
-
67
-
68
-
69
-
70
-
71
-
72
-
73
-
74
-
75
-
76
-
77
-
78
-
79
-
80
-
81
-
82
-
83
-
84
-
85
-
86
-
87
-
88
-
89
-
90
-
91
-
92
-
93
-
94
-
95
-
96
-
97
-
98
-
99
-
100
-
101
-
102
-
103
-
104
-
105
-
106
-
107
-
108
-
109
-
110
-
111
-
112
-
113
-
114
-
115
-
116
-
117
-
118
-
119
-
120
-
121
-
122
-
123
-
124
-
125
-
126
-
127
-
128
-
129
-
130
-
131
-
132
-
133
-
134
-
135
-
136
-
137
-
138
-
139
-
140
-
141
-
142
-
143
-
144
-
145
-
146
-
147
-
148
-
149
-
150
-
151
-
152
-
153
-
154
-
155
-
156
-
157
-
158
-
159
-
160
-
161
-
162
-
163
-
164
-
165
-
166
-
167
-
168
-
169
-
170
-
171
-
172
-
173
-
174
-
175
-
176
-
177
-
178
-
179
-
180
-
181
-
182
-
183
-
184
-
185
-
186
-
187
-
 188
188 -
 189
189 -
 190
190 -
 191
191 -
 192
192 -
 193
193 -
 194
194 -
 195
195 -
 196
196 -
 197
197 -
 198
198 -
 199
199 -
 200
200 -
 201
201 -
 202
202 -
 203
203 -
 204
204 -
 205
205 -
 206
206 -
 207
207 -
 208
208 -
209
-
210
-
211
-
212
-
213
-
214
-
215
-
216
-
217
-
218
-
219
-
220
-
221
-
222
-
223
-
224
-
225
-
226
-
227
-
228
-
229
-
230
-
231
-
232
-
233
-
234
 |
 |
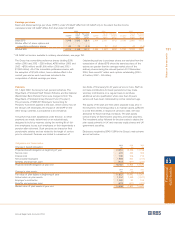
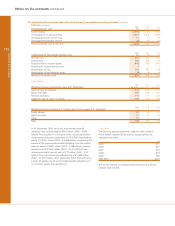
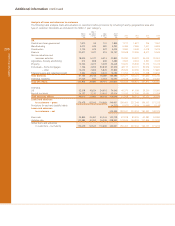
If the compensation cost for the schemes had been determined based on the fair value at the grant dates consistent with the fair value
method of SFAS 123, net income and earnings per share as adjusted to include stock compensation would have been as shown below:
2004 2003 2002
£m £m £m
Net income under US GAAP:
As reported 3,948 2,564 3,108
Adjusted to include stock compensation 3,909 2,503 2,978
Basic earnings per share under US GAAP:
As reported 128.0p 87.5p 107.9p
Adjusted to include stock compensation 126.7p 85.4p 103.4p
Diluted earnings per share under US GAAP:
As reported 127.1p 86.8p 106.3p
Adjusted to include stock compensation 125.9p 84.8p 101.8p
The fair value of each option has been estimated as at the grant date using a Black-Scholes option pricing model using the following
assumptions:
2004 2003 2002
Risk free interest rate 4.8% – 5.2% 3.6%– 4.6% 4.7%– 4.9%
Volatility based on historical data 18% 29% 43%
Dividend yield 3.3%– 3.7% 2.9%–4.1% 2.4% –2.9%
Expected lives of options granted under:
Employee savings scheme 3, 5 and 7 years 3, 5 and 7 years 3, 5 and 7 years
Executive scheme 3 to 10 years 3 to 10 years 3 to 10 years
Option 2000 scheme 3 years 3 years 3 years
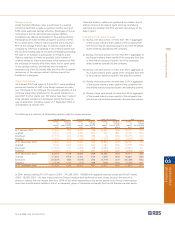
The following table summarises fair values of options issued in each year:
2004 2003 2002
Exercise price Fair value Life Exercise price Fair value Life Exercise price Fair value Life
£ £ Years £ £ Years £ £ Years
Executive scheme (1) 16.98 2.85 3 -10 13.48 2.91 3 -10 18.10 6.54 3 -10
Savings scheme
3 year 13.07 3.83 3 13.07 4.64 3 12.35 5.58 3
5 year 13.07 4.09 5 13.07 5.15 5 12.35 6.33 5
7 year 13.07 4.24 7 13.07 5.48 7 12.35 6.76 7
Option 2000 scheme 15.53 1.93 3 15.90 2.91 3 18.41 5.44 3
Note:
(1) For the purposes of calculating a fair value on executive scheme options, an option life of 5 years, being the mid-point on the 10 year option, has been assumed.
Historical exercise trends have not been used as these are not felt to be indicative of future trends given changes to the scheme rules and participants in the scheme.
196
Notes on the accounts
Notes on the accounts continued
53 Significant differences between UK and US generally accepted accounting principles (continued)
Stock-based compensation costs (continued)
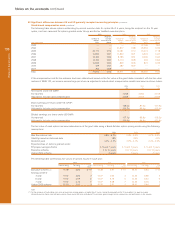
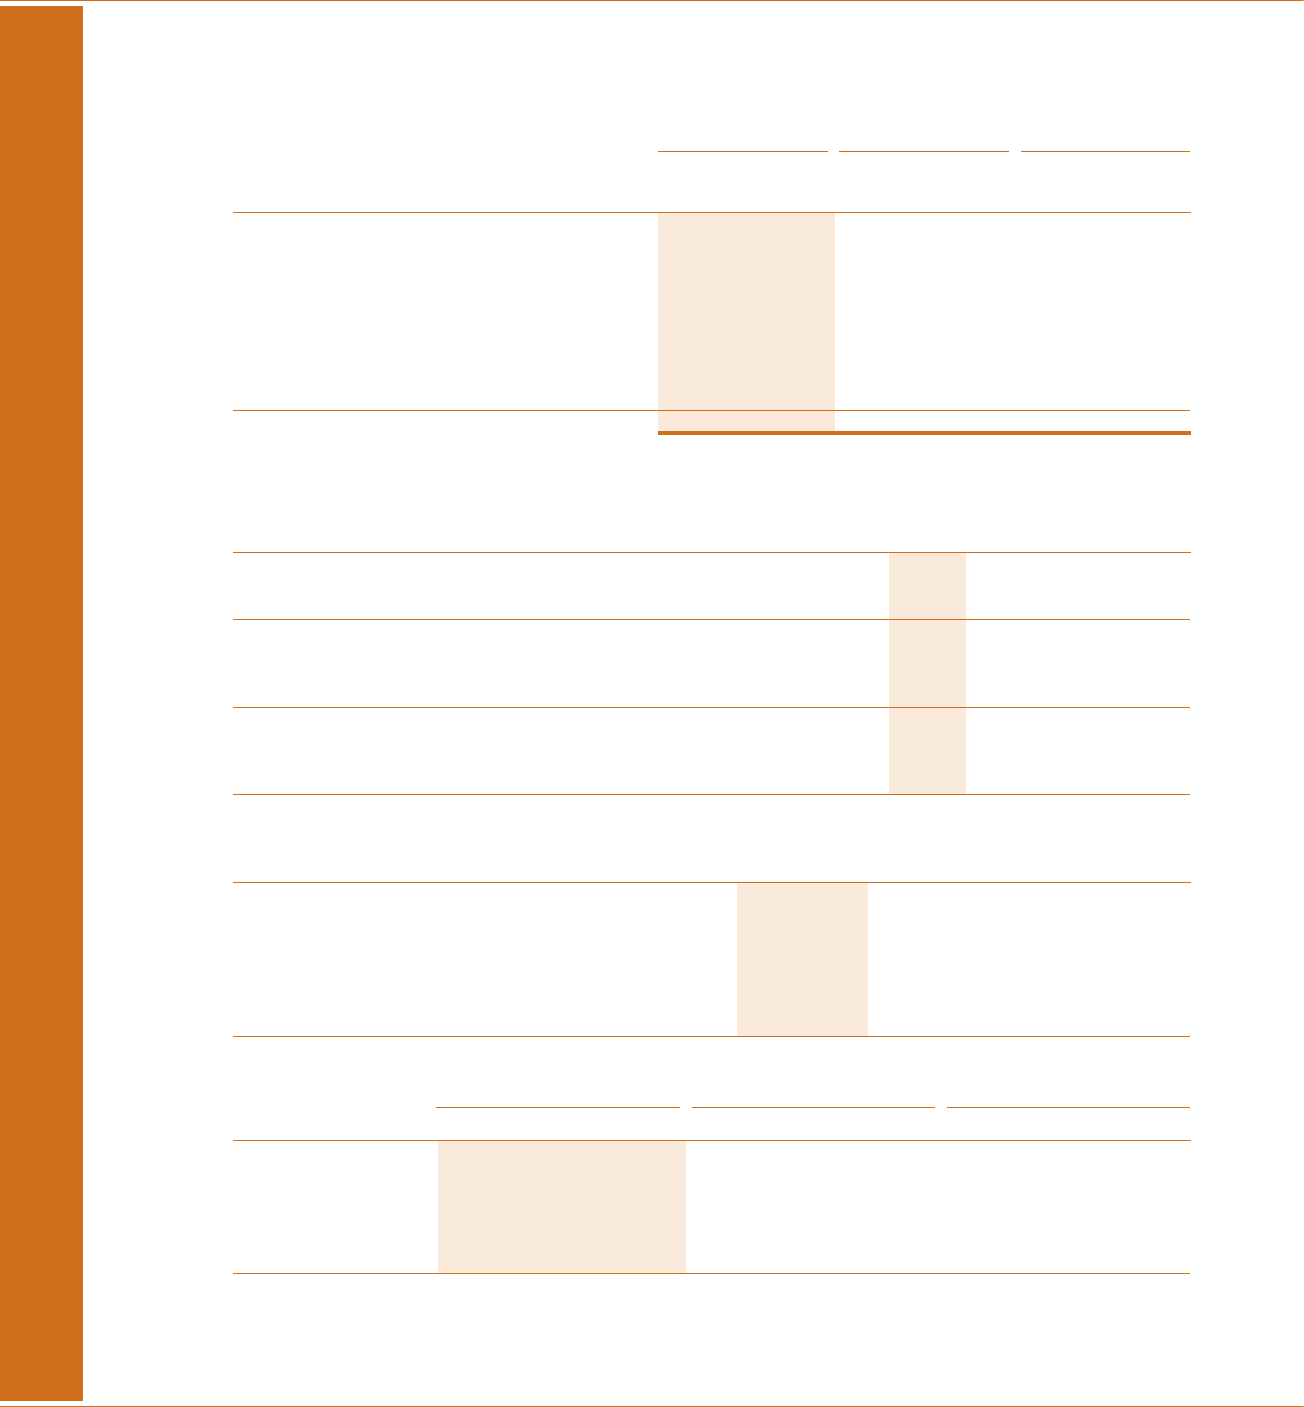
The following table shows options outstanding by normal exercise date. An option life of 5 years, being the midpoint on the 10 year
option, has been assumed for options granted under Group and former NatWest executive plans.
2004 2003 2002
Weighted Weighted Weighted
Number of average Number of average Number of average
options exercise price options exercise price options exercise price
Year exercisable 000’s pence 000’s pence 000’s pence
2003 — — — — 27,769 963
2004 — — 31,817 1188 25,553 1226
2005 26,117 1214 14,081 1112 15,473 1118
2006 10,832 1421 11,822 1421 6,924 1447
2007 14,360 1324 8,785 1351 9,265 1343
2008 8,760 1327 9,110 1328 494 1364
2009 10,549 1423 809 1235 872 1235
2010 429 1307 487 1307 — —
2011 763 1209 ————
Total 71,810 1312 76,911 1246 86,350 1153