RBS 2004 Annual Report Download - page 83
Download and view the complete annual report
Please find page 83 of the 2004 RBS annual report below. You can navigate through the pages in the report by either clicking on the pages listed below, or by using the keyword search tool below to find specific information within the annual report.-
 1
1 -
2
-
3
-
4
-
5
-
6
-
7
-
8
-
9
-
10
-
11
-
12
-
13
-
14
-
15
-
16
-
17
-
18
-
19
-
20
-
21
-
22
-
23
-
24
-
25
-
26
-
27
-
28
-
29
-
30
-
31
-
32
-
33
-
34
-
35
-
36
-
37
-
38
-
39
-
40
-
41
-
42
-
43
-
44
-
45
-
46
-
47
-
48
-
49
-
50
-
51
-
52
-
53
-
54
-
55
-
56
-
57
-
58
-
59
-
60
-
61
-
62
-
63
-
64
-
65
-
66
-
67
-
68
-
69
-
70
-
71
-
72
-
 73
73 -
 74
74 -
 75
75 -
 76
76 -
 77
77 -
 78
78 -
 79
79 -
 80
80 -
 81
81 -
 82
82 -
 83
83 -
 84
84 -
 85
85 -
 86
86 -
 87
87 -
 88
88 -
 89
89 -
 90
90 -
 91
91 -
 92
92 -
 93
93 -
94
-
95
-
96
-
97
-
98
-
99
-
100
-
101
-
102
-
103
-
104
-
105
-
106
-
107
-
108
-
109
-
110
-
111
-
112
-
113
-
114
-
115
-
116
-
117
-
118
-
119
-
120
-
121
-
122
-
123
-
124
-
125
-
126
-
127
-
128
-
129
-
130
-
131
-
132
-
133
-
134
-
135
-
136
-
137
-
138
-
139
-
140
-
141
-
142
-
143
-
144
-
145
-
146
-
147
-
148
-
149
-
150
-
151
-
152
-
153
-
154
-
155
-
156
-
157
-
158
-
159
-
160
-
161
-
162
-
163
-
164
-
165
-
166
-
167
-
168
-
169
-
170
-
171
-
172
-
173
-
174
-
175
-
176
-
177
-
178
-
179
-
180
-
181
-
182
-
183
-
184
-
185
-
186
-
187
-
188
-
189
-
190
-
191
-
192
-
193
-
194
-
195
-
196
-
197
-
198
-
199
-
200
-
201
-
202
-
203
-
204
-
205
-
206
-
207
-
208
-
209
-
210
-
211
-
212
-
213
-
214
-
215
-
216
-
217
-
218
-
219
-
220
-
221
-
222
-
223
-
224
-
225
-
226
-
227
-
228
-
229
-
230
-
231
-
232
-
233
-
234
 |
 |

section
01
Operating and
financial review
81
Annual Report and Accounts 2004
Operating and financial review
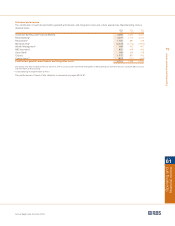
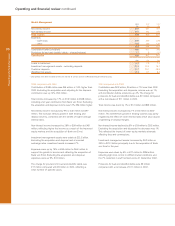
2003 compared with 2002
Contribution increased by 11% or £359 million to £3,620
million. As well as in the UK, the division also achieved good
growth in Europe and North America.
Total income was up 11% or £645 million to £6,697 million with
strong growth across all business areas.
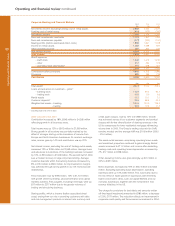
Average loans and advances to customers of the banking
business increased by 9% or £7.5 billion to £94.3 billion.
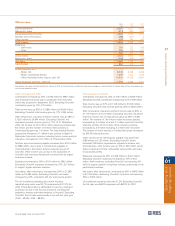
Lending margin was maintained. Average customer deposits
within the banking businesses increased by 7% or £4.1 billion
to £61.0 billion; however, the lower interest rate environment
adversely affected deposit margins as it reduced the benefit of
interest free funds. Net interest income was further impacted
by the effect of implementing from 1 January 2003 the pricing
remedies agreed following the Competition Commission inquiry
into SME banking and by lower money market income, due to
less favourable market conditions.
The asset rental business comprising operating leases and
investment properties, grew strongly. Rental assets increased
to £10.1 billion and net income after deducting funding costs
and operating lease depreciation increased by 28%, £53
million to £241 million.
Fees receivable rose by £143 million, 10% to £1,537 million
due to growth in fees related to lending and from the
expansion and success of capital markets activities. Fees
payable including brokerage were up £63 million to £220
million due to higher volumes in Financial Markets.
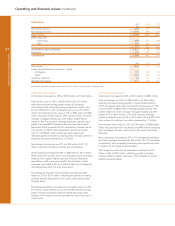
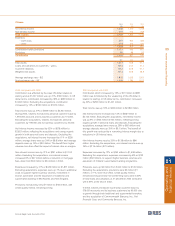
Dealing profits which is income (before associated direct costs)
arising from our role in providing customers with debt and risk
management products in interest rate, currency and credit
asset classes, rose by 24% to £1,661 million providing
incremental profit contribution of some £170 million. There was
steady growth in underlying customer volumes in all product
areas. While first half performance was particularly strong
given the unusually high levels of demand for mortgage
backed securities in the United States, dealing revenues in the
second half were up 10% on the prior year period, in line with
the growth in income for the division as a whole.
Other operating income was up £110 million, 56% to £307
million partially due to the full year effect of the inclusion of
Dixon Motors’ gross profit.
Direct expenses increased by 12% or £256 million to £2,322
million. Excluding the effect of the acquisition of Nordisk
Renting and Dixon Motors and operating lease depreciation,
operating expenses were up 10%, £161 million. This was due
to performance related costs associated with the strong growth
in trading revenues, expansion in all business areas and
continued investment in capital market activities and in the
growing overseas franchise.
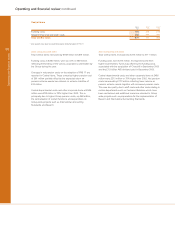
The charge for provisions for bad debts and amounts written
off fixed asset investments amounted to £755 million, an
increase of £30 million. The charge in the second half of the
year was £351 million, 13% lower than the first half. The
increase in provisions of 4% over last year was less than the
growth in lending of 9%, reflecting an improvement in credit
quality and the economic environment during 2003.