RBS 2004 Annual Report Download - page 105
Download and view the complete annual report
Please find page 105 of the 2004 RBS annual report below. You can navigate through the pages in the report by either clicking on the pages listed below, or by using the keyword search tool below to find specific information within the annual report.-
 1
1 -
2
-
3
-
4
-
5
-
6
-
7
-
8
-
9
-
10
-
11
-
12
-
13
-
14
-
15
-
16
-
17
-
18
-
19
-
20
-
21
-
22
-
23
-
24
-
25
-
26
-
27
-
28
-
29
-
30
-
31
-
32
-
33
-
34
-
35
-
36
-
37
-
38
-
39
-
40
-
41
-
42
-
43
-
44
-
45
-
46
-
47
-
48
-
49
-
50
-
51
-
52
-
53
-
54
-
55
-
56
-
57
-
58
-
59
-
60
-
61
-
62
-
63
-
64
-
65
-
66
-
67
-
68
-
69
-
70
-
71
-
72
-
73
-
74
-
75
-
76
-
77
-
78
-
79
-
80
-
81
-
82
-
83
-
84
-
85
-
86
-
87
-
88
-
89
-
90
-
91
-
92
-
93
-
94
-
 95
95 -
 96
96 -
 97
97 -
 98
98 -
 99
99 -
 100
100 -
 101
101 -
 102
102 -
 103
103 -
 104
104 -
 105
105 -
 106
106 -
 107
107 -
 108
108 -
 109
109 -
 110
110 -
 111
111 -
 112
112 -
 113
113 -
 114
114 -
 115
115 -
116
-
117
-
118
-
119
-
120
-
121
-
122
-
123
-
124
-
125
-
126
-
127
-
128
-
129
-
130
-
131
-
132
-
133
-
134
-
135
-
136
-
137
-
138
-
139
-
140
-
141
-
142
-
143
-
144
-
145
-
146
-
147
-
148
-
149
-
150
-
151
-
152
-
153
-
154
-
155
-
156
-
157
-
158
-
159
-
160
-
161
-
162
-
163
-
164
-
165
-
166
-
167
-
168
-
169
-
170
-
171
-
172
-
173
-
174
-
175
-
176
-
177
-
178
-
179
-
180
-
181
-
182
-
183
-
184
-
185
-
186
-
187
-
188
-
189
-
190
-
191
-
192
-
193
-
194
-
195
-
196
-
197
-
198
-
199
-
200
-
201
-
202
-
203
-
204
-
205
-
206
-
207
-
208
-
209
-
210
-
211
-
212
-
213
-
214
-
215
-
216
-
217
-
218
-
219
-
220
-
221
-
222
-
223
-
224
-
225
-
226
-
227
-
228
-
229
-
230
-
231
-
232
-
233
-
234
 |
 |
section
01
103
Annual Report and Accounts 2004
Operating and financial review
Operating and
financial review
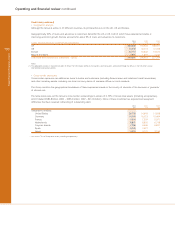
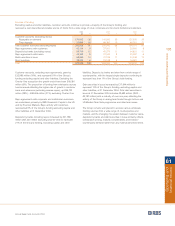
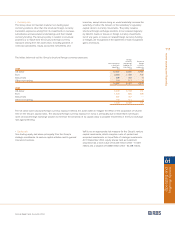
Analysis of specific provisions
The table below shows specific provisions by industry and geographic area.
2004 2003 2002
£m £m £m
Industry:
Finance 66 65 125
Individuals – home mortgages 46 37 67
Individuals – other 1,617 1,159 955
Other commercial and industrial 1,919 2,095 2,176
3,648 3,356 3,323
Geography:
UK 2,738 2,507 2,615
US 646 609 556
Europe 262 224 110
Rest of the World 2 16 42
3,648 3,356 3,323
Notes:
(1) Excludes specific provisions against loans and advances to banks of £6 million (2003 – £7 million; 2002 – £7 million).
(2) The geographic analysis is based on location of office. The UK includes domestic transactions and transactions conducted through the offices in the UK which service
international banking transactions.
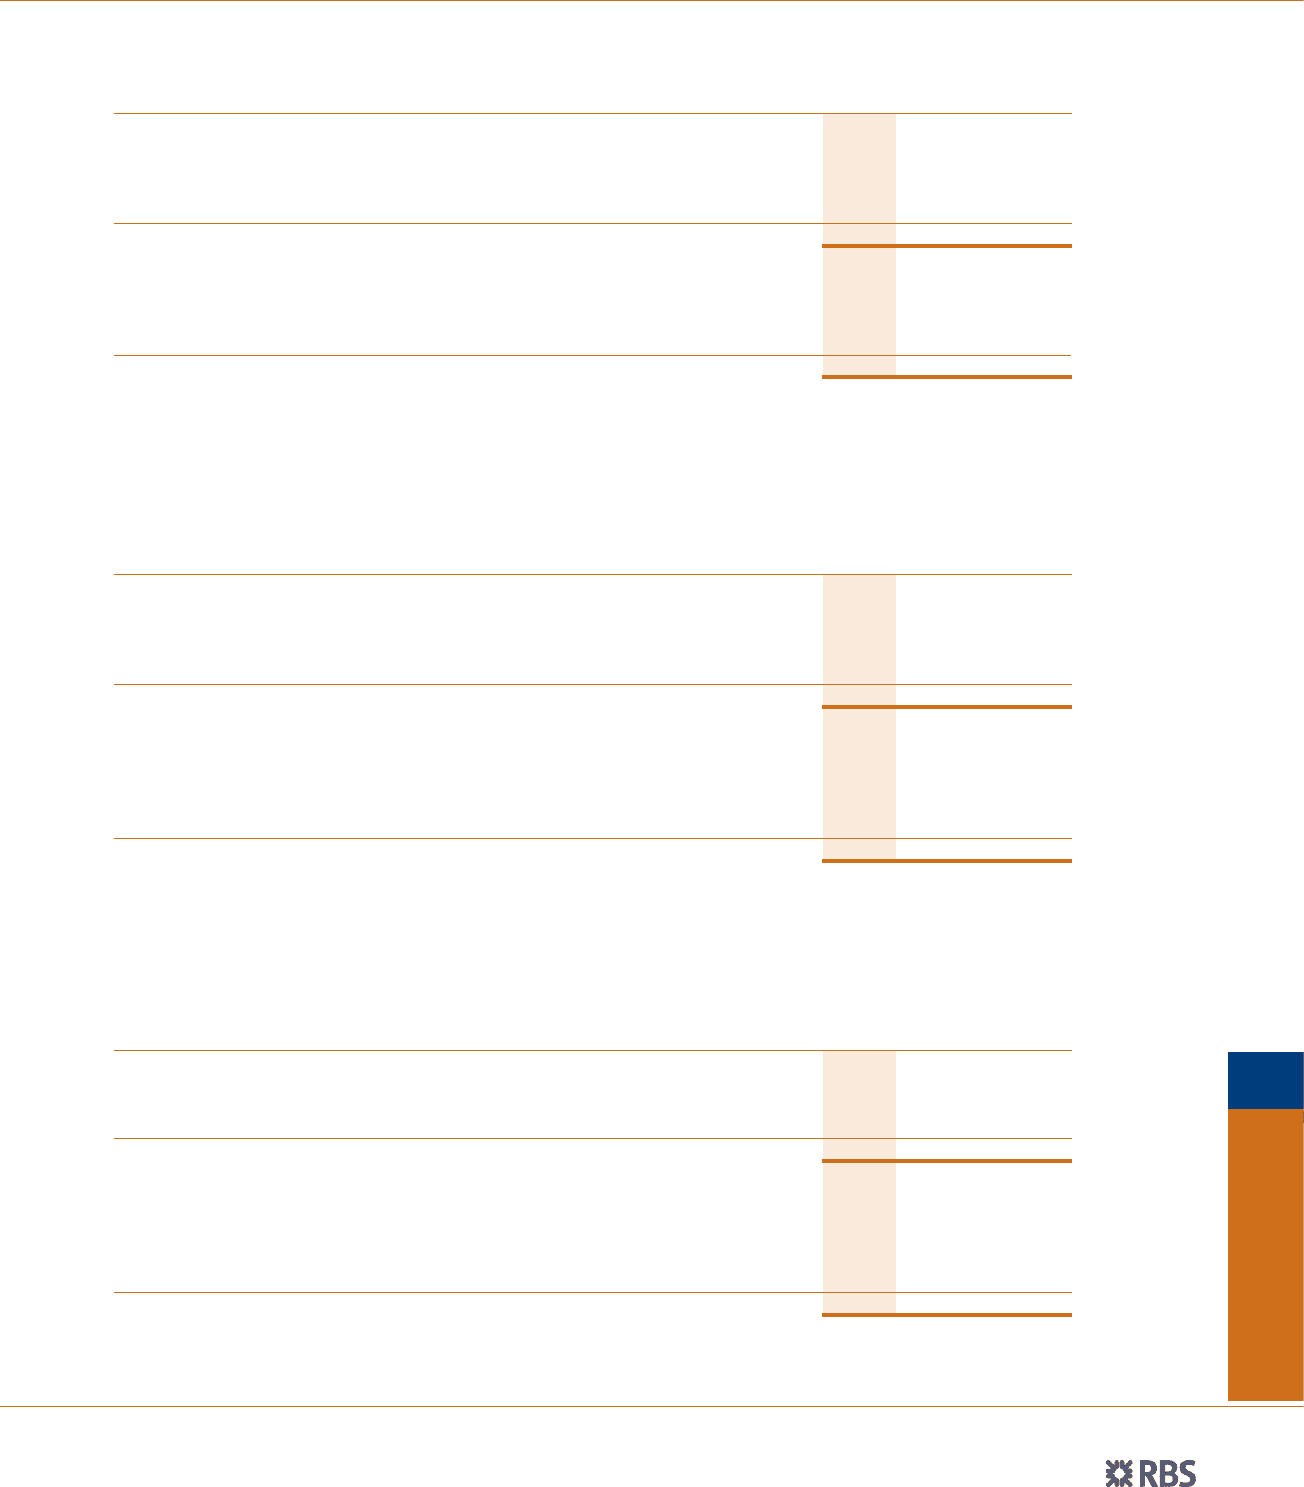
Amounts written off and recovered
The table below shows the amounts written off by industry and geographical area.
2004 2003 2002
£m £m £m
Industry:
Finance 20 66 44
Individuals – home mortgages 4 22
Individuals – other 676 415 391
Other commercial and industrial 768 1,036 598
1,468 1,519 1,035
Geography:
UK 1,109 1,333 803
US 292 156 164
Europe 54 15 40
Rest of the World 13 15 28
Total amounts written off 1,468 1,519 1,035
Notes:
(1) Excludes amounts written off in respect of banks of nil (2003 – nil; 2002 – £1 million).
(2) The geographic analysis is based on location of office. The UK includes domestic transactions and transactions conducted through the offices in the UK which service
international banking transactions.
The following table shows amounts previously written off and subsequently recovered during the year by industry and geographical area.
2004 2003 2002
£m £m £m
Industry:
Finance 41—
Individuals – other 105 42 41
Other commercial and industrial 38 29 22
147 72 63
Geography:
UK 88 38 37
US 46 25 21
Europe 4 44
Rest of the World 9 51
Total recoveries 147 72 63
Notes:
(1) The geographic analysis is based on location of office. The UK includes domestic transactions and transactions conducted through the offices in the UK which service
international banking transactions.