RBS 2004 Annual Report Download - page 74
Download and view the complete annual report
Please find page 74 of the 2004 RBS annual report below. You can navigate through the pages in the report by either clicking on the pages listed below, or by using the keyword search tool below to find specific information within the annual report.-
 1
1 -
2
-
3
-
4
-
5
-
6
-
7
-
8
-
9
-
10
-
11
-
12
-
13
-
14
-
15
-
16
-
17
-
18
-
19
-
20
-
21
-
22
-
23
-
24
-
25
-
26
-
27
-
28
-
29
-
30
-
31
-
32
-
33
-
34
-
35
-
36
-
37
-
38
-
39
-
40
-
41
-
42
-
43
-
44
-
45
-
46
-
47
-
48
-
49
-
50
-
51
-
52
-
53
-
54
-
55
-
56
-
57
-
58
-
59
-
60
-
61
-
62
-
63
-
 64
64 -
 65
65 -
 66
66 -
 67
67 -
 68
68 -
 69
69 -
 70
70 -
 71
71 -
 72
72 -
 73
73 -
 74
74 -
 75
75 -
 76
76 -
 77
77 -
 78
78 -
 79
79 -
 80
80 -
 81
81 -
 82
82 -
 83
83 -
 84
84 -
85
-
86
-
87
-
88
-
89
-
90
-
91
-
92
-
93
-
94
-
95
-
96
-
97
-
98
-
99
-
100
-
101
-
102
-
103
-
104
-
105
-
106
-
107
-
108
-
109
-
110
-
111
-
112
-
113
-
114
-
115
-
116
-
117
-
118
-
119
-
120
-
121
-
122
-
123
-
124
-
125
-
126
-
127
-
128
-
129
-
130
-
131
-
132
-
133
-
134
-
135
-
136
-
137
-
138
-
139
-
140
-
141
-
142
-
143
-
144
-
145
-
146
-
147
-
148
-
149
-
150
-
151
-
152
-
153
-
154
-
155
-
156
-
157
-
158
-
159
-
160
-
161
-
162
-
163
-
164
-
165
-
166
-
167
-
168
-
169
-
170
-
171
-
172
-
173
-
174
-
175
-
176
-
177
-
178
-
179
-
180
-
181
-
182
-
183
-
184
-
185
-
186
-
187
-
188
-
189
-
190
-
191
-
192
-
193
-
194
-
195
-
196
-
197
-
198
-
199
-
200
-
201
-
202
-
203
-
204
-
205
-
206
-
207
-
208
-
209
-
210
-
211
-
212
-
213
-
214
-
215
-
216
-
217
-
218
-
219
-
220
-
221
-
222
-
223
-
224
-
225
-
226
-
227
-
228
-
229
-
230
-
231
-
232
-
233
-
234
 |
 |

72
Operating and financial review
Operating and financial review continued
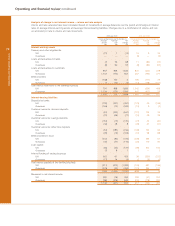
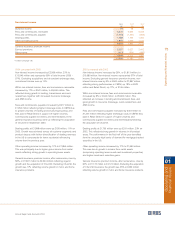
Average balance sheet and related interest
2004 2003*
Average Average
balance Interest Rate balance Interest Rate
£m £m % £m £m %
Assets
Treasury and other eligible bills – UK 835 34 4.07 1,378 48 3.48
– Overseas 62 1 1.61 64 1 1.56
Loans and advances to banks – UK 13,528 527 3.90 13,724 459 3.34
– Overseas 9,189 264 2.87 9,559 212 2.22
Loans and advances to customers – UK 184,837 11,152 6.03 168,390 9,519 5.65
– Overseas 69,118 3,201 4.63 44,862 2,240 4.99
Debt securities – UK 19,549 756 3.87 23,810 754 3.17
– Overseas 18,132 761 4.20 17,927 765 4.27
Total interest-earning assets – banking business 315,250 16,696 5.30 279,714 13,998 5.00
– trading business (3) 133,353 96,648
Total interest-earning assets 448,603 376,362
Non-interest-earning assets 70,510 66,060
Total assets 519,113 442,422
Percentage of assets applicable to overseas operations 33.1% 32.4%
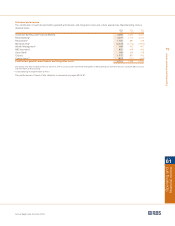
Liabilities and shareholders’ equity
Deposits by banks – UK 35,059 1,060 3.02 28,220 703 2.49
– Overseas 16,425 398 2.42 9,565 218 2.28
Customer accounts: demand deposits – UK 67,519 1,569 2.32 64,469 1,028 1.59
– Overseas 11,580 147 1.27 9,166 70 0.76
Customer accounts: savings deposits – UK 24,147 673 2.79 18,653 503 2.70
– Overseas 18,349 252 1.37 16,310 260 1.59
Customer accounts: other time deposits – UK 51,591 1,712 3.32 49,880 1,478 2.96
– Overseas 20,725 479 2.31 16,642 374 2.25
Debt securities in issue – UK 37,097 1,229 3.31 29,977 914 3.05
– Overseas 12,320 229 1.86 9,630 119 1.24
Loan capital – UK 17,959 665 3.70 15,342 534 3.48
– Overseas 235 15 6.38 154 16 10.39
Internal funding of trading business – UK (35,317) (920) 2.60 (21,258) (497) 2.34
– Overseas (758) (20) 2.64 (1,651) (23) 1.39
Total interest-bearing liabilities – banking business 276,931 7,488 2.70 245,099 5,697 2.32
– trading business (3) 131,743 93,466
Total interest-bearing liabilities 408,674 338,565
Non-interest-bearing liabilities
Demand deposits – UK 17,765 17,589
– Overseas 9,101 7,330
Other liabilities 53,726 52,810
Shareholders’ funds – equity 26,538 22,973
– non-equity 3,309 3,155
Total liabilities and shareholders’ equity 519,113 442,422
Percentage of liabilities applicable to overseas operations 30.6% 30.6%
* restated (see page 139)
Notes:
(1) The analysis into UK and Overseas has been compiled on the basis of location of office.
(2) Loans and advances to customers include non-accrual loans. Interest income includes income on non-accruing loans only to the extent cash payments have been received.
(3) Interest receivable and interest payable on trading assets and liabilities are included in dealing profits.