RBS 2004 Annual Report Download - page 73
Download and view the complete annual report
Please find page 73 of the 2004 RBS annual report below. You can navigate through the pages in the report by either clicking on the pages listed below, or by using the keyword search tool below to find specific information within the annual report.-
 1
1 -
2
-
3
-
4
-
5
-
6
-
7
-
8
-
9
-
10
-
11
-
12
-
13
-
14
-
15
-
16
-
17
-
18
-
19
-
20
-
21
-
22
-
23
-
24
-
25
-
26
-
27
-
28
-
29
-
30
-
31
-
32
-
33
-
34
-
35
-
36
-
37
-
38
-
39
-
40
-
41
-
42
-
43
-
44
-
45
-
46
-
47
-
48
-
49
-
50
-
51
-
52
-
53
-
54
-
55
-
56
-
57
-
58
-
59
-
60
-
61
-
62
-
 63
63 -
 64
64 -
 65
65 -
 66
66 -
 67
67 -
 68
68 -
 69
69 -
 70
70 -
 71
71 -
 72
72 -
 73
73 -
 74
74 -
 75
75 -
 76
76 -
 77
77 -
 78
78 -
 79
79 -
 80
80 -
 81
81 -
 82
82 -
 83
83 -
84
-
85
-
86
-
87
-
88
-
89
-
90
-
91
-
92
-
93
-
94
-
95
-
96
-
97
-
98
-
99
-
100
-
101
-
102
-
103
-
104
-
105
-
106
-
107
-
108
-
109
-
110
-
111
-
112
-
113
-
114
-
115
-
116
-
117
-
118
-
119
-
120
-
121
-
122
-
123
-
124
-
125
-
126
-
127
-
128
-
129
-
130
-
131
-
132
-
133
-
134
-
135
-
136
-
137
-
138
-
139
-
140
-
141
-
142
-
143
-
144
-
145
-
146
-
147
-
148
-
149
-
150
-
151
-
152
-
153
-
154
-
155
-
156
-
157
-
158
-
159
-
160
-
161
-
162
-
163
-
164
-
165
-
166
-
167
-
168
-
169
-
170
-
171
-
172
-
173
-
174
-
175
-
176
-
177
-
178
-
179
-
180
-
181
-
182
-
183
-
184
-
185
-
186
-
187
-
188
-
189
-
190
-
191
-
192
-
193
-
194
-
195
-
196
-
197
-
198
-
199
-
200
-
201
-
202
-
203
-
204
-
205
-
206
-
207
-
208
-
209
-
210
-
211
-
212
-
213
-
214
-
215
-
216
-
217
-
218
-
219
-
220
-
221
-
222
-
223
-
224
-
225
-
226
-
227
-
228
-
229
-
230
-
231
-
232
-
233
-
234
 |
 |
section
01
Operating and
financial review
71
Annual Report and Accounts 2004
Operating and financial review
Analysis of results
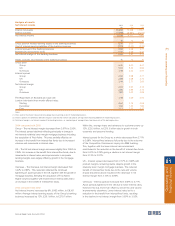
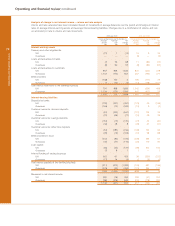
Net interest income 2004 2003 2002
£m £m £m
Interest receivable 16,696 13,998 13,561
Interest payable (7,488) (5,697) (5,712)
Net interest income 9,208 8,301 7,849
%% %
Gross yield on interest-earning assets of the banking business 5.30 5.00 5.41
Cost of interest-bearing liabilities of the banking business (2.70) (2.32) (2.70)
Interest spread of the banking business 2.60 2.68 2.71
Benefit from interest-free funds 0.32 0.29 0.42
Net interest margin of the banking business 2.92 2.97 3.13
Yields, spreads and margins of the banking business % %%
Gross yield
Group 5.30 5.00 5.41
UK 5.70 5.20 5.56
Overseas 4.38 4.44 4.97
Interest spread
Group 2.60 2.68 2.71
UK 2.68 2.68 2.72
Overseas 2.48 2.71 2.69
Net interest margin
Group 2.92 2.97 3.13
UK 2.96 2.95 3.14
Overseas 2.83 3.02 3.09
The Royal Bank of Scotland plc base rate 4.38 3.69 4.00
London inter-bank three month offered rates:
Sterling 4.64 3.74 4.06
Eurodollar 1.62 1.22 1.80
Euro 2.11 2.33 3.32
Notes:
(1) Gross yield is the interest rate earned on average interest-earning assets of the banking business.
(2) Interest spread is the difference between the gross yield and the interest rate paid on average interest-bearing liabilities of the banking business.
(3) Net interest margin is net interest income of the banking business as a percentage of average interest-earning assets of the banking business.
2004 compared with 2003
Group – The net interest margin decreased from 2.97% to 2.92%.
The interest spread declined reflecting principally a change in
mix towards relatively lower margin mortgage business including
the acquisition of First Active. This was partially offset by an
increase in the benefit from interest-free funds due to increased
volumes and movements in interest rates.
UK – The UK net interest margin increased slightly from 2.95% to
2.96%. An increase in the benefit from interest-free funds, due to
movements in interest rates, and improvements in corporate
lending margins were largely offset by growth in the mortgage
business.
Overseas – The Overseas net interest margin decreased from
3.02% to 2.83%. This reduction reflected the continued
tightening of asset spreads in the US, together with the growth in
mortgage business following the acquisition of First Active.
Higher volumes together with movements in interest rates led to
an increase in the benefit of interest-free funds.
2003 compared with 2002
Net interest income increased by 6%, £452 million, to £8,301
million. Average interest-earning assets of the Group’s banking
business increased by 12%, £29.1 billion, to £279.7 billion.
Within this, average loans and advances to customers were up
12%, £23.3 billion, to £213.3 billion due to growth in both
corporate and personal lending.
Interest spread for the Group as a whole decreased from 2.71%
to 2.68%. Interest-free balances fell partly due to the outcome
of the Competition Commission inquiry into SME banking.
This, together with the lower interest rate environment
contributed to the reduction in the benefit of interest-free funds
from 0.42% to 0.29% giving a decline in net interest margin
from 3.13% to 2.97%.
UK – Interest spread decreased from 2.72% to 2.68% with
product margins remaining stable despite growth in the
relatively lower margin mortgage business. The reduced
benefit of interest-free funds due to the rate and volume
impact described above resulted in the decrease in net
interest margin from 3.14% to 2.95%.
Overseas – Interest spread increased from 2.69% to 2.71%.
Asset spreads tightened in the US due to lower interest rates;
however, this was more than offset by overall mix and volume
improvements elsewhere. Lower interest rates led to a
reduction in the benefit from interest-free funds, resulting
in the decline in net interest margin from 3.09% to 3.02%.