RBS 2004 Annual Report Download - page 91
Download and view the complete annual report
Please find page 91 of the 2004 RBS annual report below. You can navigate through the pages in the report by either clicking on the pages listed below, or by using the keyword search tool below to find specific information within the annual report.-
 1
1 -
2
-
3
-
4
-
5
-
6
-
7
-
8
-
9
-
10
-
11
-
12
-
13
-
14
-
15
-
16
-
17
-
18
-
19
-
20
-
21
-
22
-
23
-
24
-
25
-
26
-
27
-
28
-
29
-
30
-
31
-
32
-
33
-
34
-
35
-
36
-
37
-
38
-
39
-
40
-
41
-
42
-
43
-
44
-
45
-
46
-
47
-
48
-
49
-
50
-
51
-
52
-
53
-
54
-
55
-
56
-
57
-
58
-
59
-
60
-
61
-
62
-
63
-
64
-
65
-
66
-
67
-
68
-
69
-
70
-
71
-
72
-
73
-
74
-
75
-
76
-
77
-
78
-
79
-
80
-
 81
81 -
 82
82 -
 83
83 -
 84
84 -
 85
85 -
 86
86 -
 87
87 -
 88
88 -
 89
89 -
 90
90 -
 91
91 -
 92
92 -
 93
93 -
 94
94 -
 95
95 -
 96
96 -
 97
97 -
 98
98 -
 99
99 -
 100
100 -
 101
101 -
102
-
103
-
104
-
105
-
106
-
107
-
108
-
109
-
110
-
111
-
112
-
113
-
114
-
115
-
116
-
117
-
118
-
119
-
120
-
121
-
122
-
123
-
124
-
125
-
126
-
127
-
128
-
129
-
130
-
131
-
132
-
133
-
134
-
135
-
136
-
137
-
138
-
139
-
140
-
141
-
142
-
143
-
144
-
145
-
146
-
147
-
148
-
149
-
150
-
151
-
152
-
153
-
154
-
155
-
156
-
157
-
158
-
159
-
160
-
161
-
162
-
163
-
164
-
165
-
166
-
167
-
168
-
169
-
170
-
171
-
172
-
173
-
174
-
175
-
176
-
177
-
178
-
179
-
180
-
181
-
182
-
183
-
184
-
185
-
186
-
187
-
188
-
189
-
190
-
191
-
192
-
193
-
194
-
195
-
196
-
197
-
198
-
199
-
200
-
201
-
202
-
203
-
204
-
205
-
206
-
207
-
208
-
209
-
210
-
211
-
212
-
213
-
214
-
215
-
216
-
217
-
218
-
219
-
220
-
221
-
222
-
223
-
224
-
225
-
226
-
227
-
228
-
229
-
230
-
231
-
232
-
233
-
234
 |
 |

section
01
Operating and
financial review
89
Annual Report and Accounts 2004
Operating and financial review
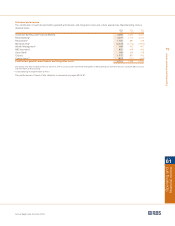
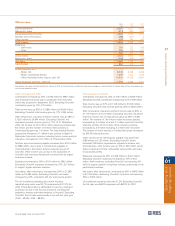
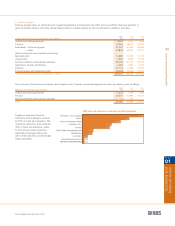
Citizens
2004 2003 2002
£m £m £m
Net interest income 1,540 1,310 1,248
Non-interest income 601 514 468
Total income 2,141 1,824 1,716
Expenses
– staff costs 551 505 485
– other 473 374 370
1,024 879 855
Contribution before provisions 1,117 945 861
Provisions 80 88 95
Contribution 1,037 857 766
$bn $bn $bn
Total assets 132.1 76.8 61.1
Loans and advances to customers – gross 83.4 43.5 31.4
Customer deposits 99.2 62.8 51.1
Weighted risk assets 87.4 50.8 38.8
Average exchange rate – $/£ 1.832 1.635 1.503
Spot exchange rate – $/£ 1.935 1.786 1.613
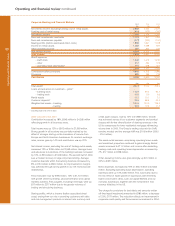
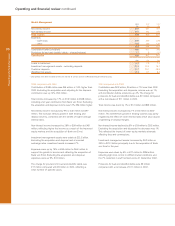
2004 compared with 2003
Contribution was affected by the weak US dollar relative to
sterling and at £1,037 million was up 21%, £180 million. In US
dollar terms, contribution increased by 36% or $499 million to
$1,900 million. Excluding the acquisitions, contribution
increased by 13% or $183 million to $1,570 million.
Total income was up 31% or $939 million to $3,923 million.
During 2004, Citizens increased its personal customer base by
1,993,000 accounts and its business customers by 174,000.
Excluding the acquisitions, Citizens increased its personal
customers by 199,000 and its business customers by 30,000.
Net interest income increased by 32% or $678 million to
$2,821 million, reflecting the acquisitions and strong organic
growth in both personal loans and deposits. Excluding the
acquisitions, net interest income increased by 11% or $228
million, average loans were up 24% or $8.8 billion and average
deposits were up 14% or $8.0 billion. The benefit from higher
volumes more than offset the impact of interest rates on margins.
Non-interest income rose by 31% or $261 million to $1,102
million. Excluding the acquisitions, non-interest income
increased 6% or $47 million before a reduction in mortgage
fees, down from $53 million to $24 million in 2004.
Expenses increased by 31% or $439 million to $1,877 million.
Excluding acquisitions, expenses were up 7% due to additional
costs to support higher business volumes, investment in
branch automation and the expansion of traditional and
supermarket banking in Mid Atlantic and New England.
Provisions increased by only $1 million to $146 million, with
credit quality metrics remaining strong.
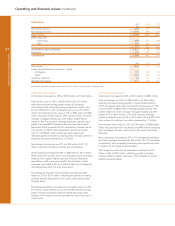
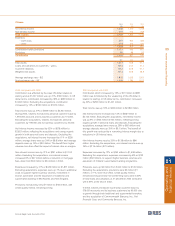
2003 compared with 2002
Contribution which increased by 12% or £91 million to £857
million was diminished by the weakening of the US dollar in
relation to sterling. In US dollar terms, contribution increased
by 22% or $250 million to $1,401 million.
Total income was up 16% or $406 million to $2,984 million.
Net interest income increased by 14% or $268 million to
$2,143 million. Excluding the acquisitions, net interest income
was up 9% or $164 million (£100 million), reflecting strong
organic growth in personal loans and deposits. Excluding the
acquisitions, average loans were up 29% or $8.0 billion and
average deposits were up 20% or $9.1 billion. The benefit of
this growth was reduced by a narrowing interest margin due to
reductions in US interest rates.
Non-interest income rose by 20% or $138 million to $841
million. Excluding the acquisitions, non-interest income was up
16% or $115 million (£70 million).
Expenses increased by 12% or $153 million to $1,438 million.
Excluding the acquisitions, expenses increased by 8% or $102
million (£62 million), to support higher business volumes and
expansion of Citizens’ supermarket banking programme.
Provisions were up $3 million from $142 million to $145 million.
Excluding the acquisitions, provisions were $2 million (£1
million), or 1%, lower than 2002. Credit quality metrics
remained strong and total non-performing loans were 0.40%
of total loans and advances at 31 December 2003 compared
with 0.57% at the end of 2002.
In 2003, Citizens increased its personal customer base by
376,000 accounts and its business customers by 36,000 due
to growth through both traditional and supermarket branches,
and the acquisition of Commonwealth Bancorp, Inc., Port
Financial Corp. and Community Bancorp, Inc.