RBS 2004 Annual Report Download - page 95
Download and view the complete annual report
Please find page 95 of the 2004 RBS annual report below. You can navigate through the pages in the report by either clicking on the pages listed below, or by using the keyword search tool below to find specific information within the annual report.-
 1
1 -
2
-
3
-
4
-
5
-
6
-
7
-
8
-
9
-
10
-
11
-
12
-
13
-
14
-
15
-
16
-
17
-
18
-
19
-
20
-
21
-
22
-
23
-
24
-
25
-
26
-
27
-
28
-
29
-
30
-
31
-
32
-
33
-
34
-
35
-
36
-
37
-
38
-
39
-
40
-
41
-
42
-
43
-
44
-
45
-
46
-
47
-
48
-
49
-
50
-
51
-
52
-
53
-
54
-
55
-
56
-
57
-
58
-
59
-
60
-
61
-
62
-
63
-
64
-
65
-
66
-
67
-
68
-
69
-
70
-
71
-
72
-
73
-
74
-
75
-
76
-
77
-
78
-
79
-
80
-
81
-
82
-
83
-
84
-
 85
85 -
 86
86 -
 87
87 -
 88
88 -
 89
89 -
 90
90 -
 91
91 -
 92
92 -
 93
93 -
 94
94 -
 95
95 -
 96
96 -
 97
97 -
 98
98 -
 99
99 -
 100
100 -
 101
101 -
 102
102 -
 103
103 -
 104
104 -
 105
105 -
106
-
107
-
108
-
109
-
110
-
111
-
112
-
113
-
114
-
115
-
116
-
117
-
118
-
119
-
120
-
121
-
122
-
123
-
124
-
125
-
126
-
127
-
128
-
129
-
130
-
131
-
132
-
133
-
134
-
135
-
136
-
137
-
138
-
139
-
140
-
141
-
142
-
143
-
144
-
145
-
146
-
147
-
148
-
149
-
150
-
151
-
152
-
153
-
154
-
155
-
156
-
157
-
158
-
159
-
160
-
161
-
162
-
163
-
164
-
165
-
166
-
167
-
168
-
169
-
170
-
171
-
172
-
173
-
174
-
175
-
176
-
177
-
178
-
179
-
180
-
181
-
182
-
183
-
184
-
185
-
186
-
187
-
188
-
189
-
190
-
191
-
192
-
193
-
194
-
195
-
196
-
197
-
198
-
199
-
200
-
201
-
202
-
203
-
204
-
205
-
206
-
207
-
208
-
209
-
210
-
211
-
212
-
213
-
214
-
215
-
216
-
217
-
218
-
219
-
220
-
221
-
222
-
223
-
224
-
225
-
226
-
227
-
228
-
229
-
230
-
231
-
232
-
233
-
234
 |
 |
section
01
Operating and
financial review
93
Annual Report and Accounts 2004
Operating and financial review
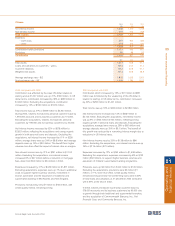
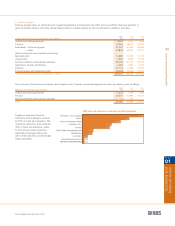
Overview of consolidated balance sheet
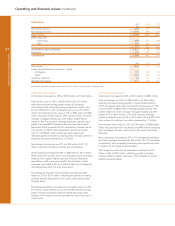
Total assets of £583.5 billion at 31 December 2004 were up
£129.0 billion, 28%, compared with 31 December 2003,
reflecting business growth and acquisitions.
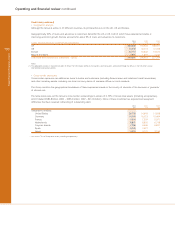
Treasury bills and other eligible bills increased by £1.3 billion,
26%, to £6.1 billion, reflecting trading activity.
Loans and advances to banks rose £6.4 billion, 12%, to £58.3
billion. Bank placings were up £2.9 billion, 11% to £28.3 billion,
and reverse repurchase agreements and stock borrowing
(“reverse repos”), were up £3.5 billion, 13%, to £30.0 billion.
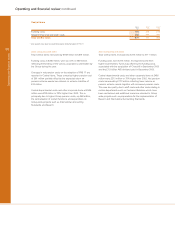
Loans and advances to customers were up £92.9 billion, 37%,
to £345.5 billion. Within this, reverse repos increased by £28.1
billion to £52.2 billion reflecting growth in trading activities.
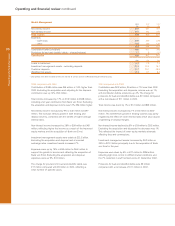
Excluding reverse repos, lending increased by £64.8 billion,
28% to £293.3 billion reflecting organic growth across all
divisions and £23.4 billion arising from acquisitions, principally
Charter One, £18.0 billion, First Active, £4.1 billion, and the
People's Bank credit card business, £1.0 billion. In $ terms,
Citizens grew US$39.5 billion, 92%, including US$32.7 billion
related to acquisitions.
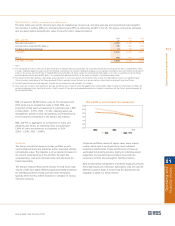
Debt securities increased by £11.3 billion, 14%, to £91.2 billion,
principally due to increased holdings in Financial Markets and
the acquisition of First Active.
Equity shares were up £0.7 billion, 29%, to £3.0 billion, mainly
due to the acquisition of Charter One and growth in Financial
Markets trading activity.
Intangible fixed assets increased by £4.4 billion, 34% to £17.6
billion. Goodwill arising on the acquisitions made during 2004
amounted to £5.9 billion, including £4.7 billion in respect of
Charter One. This was partially offset by goodwill amortisation,
£0.9 billion and the adverse effect of exchange rate
movements, £0.5 billion.
Tangible fixed assets were up £2.4 billion, 17% to £16.3 billion,
mainly reflecting growth in operating lease assets, up £1.4 billion,
22% to £7.8 billion.
Settlement balances increased by £2.8 billion to £5.7 billion as
a result of increased levels of customer activity.
Other assets rose by £4.4 billion, 25% to £22.3 billion, mainly
due to an increase in the mark-to-market value of trading
derivatives and acquisitions.
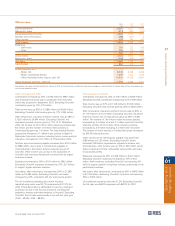
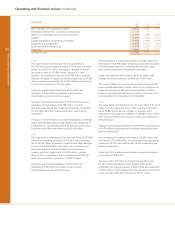
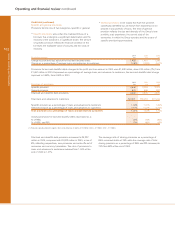
Deposits by banks increased by £31.8 billion, 47% to £99.1 billion
to fund business growth, with repurchase agreements and
stock lending (“repos”) up £16.3 billion, 60%, to £43.3 billion
and inter-bank deposits up £15.5 billion, 38% to £55.8 billion.
Customer accounts were up £48.1 billion, 20% at £285.1
billion. Within this, repos were up £15.1 billion, 56% to £42.1
billion reflecting growth in trading activities. Excluding repos,
deposits rose by £33.0 billion, 16%, to £243.0 billion with
growth in CBFM, £6.3 billion, Retail Banking, £4.1 billion,
Wealth Management, £2.7 billion, Citizens, £15.8 billion,
including the acquisition of Charter One and Ulster Bank, £3.8
billion, including First Active. In $ terms, Citizens grew US$36.4
billion, 58%, including US$29.1 billion related to acquisitions.
Debt securities in issue increased by £17.9 billion, 44%, to
£59.0 billion primarily to meet the Group's funding requirements.
The increase in settlement balances and short positions
reflected growth in customer activity.
Other liabilities rose by £5.6 billion, 27% to £26.2 billion,
principally due to an increase in the mark-to-market value of
trading derivatives.
Accruals and deferred income increased by £2.4 billion, 18%
to £15.6 billion.
Post-retirement benefit liabilities, recognised on the adoption of
FRS 17, were up £0.5 billion, 32% to £1.9 billion with actuarial
losses, net of deferred tax, up £1.1 billion, mainly due to changes
in actuarial assumptions, partially offset by asset growth and a
£750 million payment to the RBS Group Pension Fund.
Provisions for liabilities and charges increased £0.8 billion, 37%
to £3.1 billion principally due to higher provisions for deferred tax.
Subordinated liabilities were up £3.4 billion, 20% to £20.4 billion.
This reflected the issue of £1.3 billion (US$2,425 million), £0.7
billion (1,000 million) and £0.4 billion (AUD1,000 million)
dated loan capital, and £1.1 billion (£1,100 million), £1.0 billion
(1,500 million) and £0.1 billion (JPY25 billion) undated loan
capital, together with £0.1 billion of dated and undated loan
capital arising from the acquisition of First Active and £0.2 billion
dated loan capital arising from the acquisition of Charter One.
This was partially offset by the redemption of dated loan
capital, £0.7 billion (US$1,050 million and £140 million), the
conversion of £0.5 billion (US$850 million) undated loan capital
into US$ preference shares and the effect of exchange rate
movements, £0.4 billion.
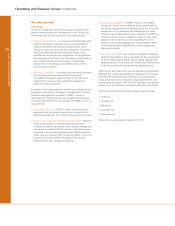
Non-equity minority interests were up £0.9 billion, 35% to £3.7
billion mainly reflecting the issues by subsidiaries of the Group
of US$950 million (£0.5 billion) non-cumulative trust preferred
securities in August 2004 and US$1,000 million (£0.6 billion) non-
cumulative trust preferred securities in August/September 2004.
Shareholders' funds increased by £5.8 billion, 22% to £31.9
billion including £2.6 billion from the placing of 165 million
ordinary shares in connection with the acquisition of Charter
One, the issue of £1.3 billion preference share capital and
conversion of £0.5 billion (US$850 million) undated loan capital
into US$ preference shares. The remainder reflects retentions
of £2.4 billion and the issue of £0.6 billion of ordinary shares
in respect of scrip dividends and the exercise of share options
and revaluation of premises, £0.1 billion, which were partly
offset by £1.1 billion actuarial losses, net of deferred tax,
recognised in post-retirement benefit schemes and the
adverse effect of exchange rate movements on share premium
account, £0.2 billion and profit and loss account, £0.4 billion.