RBS 2004 Annual Report Download - page 226
Download and view the complete annual report
Please find page 226 of the 2004 RBS annual report below. You can navigate through the pages in the report by either clicking on the pages listed below, or by using the keyword search tool below to find specific information within the annual report.-
 1
1 -
2
-
3
-
4
-
5
-
6
-
7
-
8
-
9
-
10
-
11
-
12
-
13
-
14
-
15
-
16
-
17
-
18
-
19
-
20
-
21
-
22
-
23
-
24
-
25
-
26
-
27
-
28
-
29
-
30
-
31
-
32
-
33
-
34
-
35
-
36
-
37
-
38
-
39
-
40
-
41
-
42
-
43
-
44
-
45
-
46
-
47
-
48
-
49
-
50
-
51
-
52
-
53
-
54
-
55
-
56
-
57
-
58
-
59
-
60
-
61
-
62
-
63
-
64
-
65
-
66
-
67
-
68
-
69
-
70
-
71
-
72
-
73
-
74
-
75
-
76
-
77
-
78
-
79
-
80
-
81
-
82
-
83
-
84
-
85
-
86
-
87
-
88
-
89
-
90
-
91
-
92
-
93
-
94
-
95
-
96
-
97
-
98
-
99
-
100
-
101
-
102
-
103
-
104
-
105
-
106
-
107
-
108
-
109
-
110
-
111
-
112
-
113
-
114
-
115
-
116
-
117
-
118
-
119
-
120
-
121
-
122
-
123
-
124
-
125
-
126
-
127
-
128
-
129
-
130
-
131
-
132
-
133
-
134
-
135
-
136
-
137
-
138
-
139
-
140
-
141
-
142
-
143
-
144
-
145
-
146
-
147
-
148
-
149
-
150
-
151
-
152
-
153
-
154
-
155
-
156
-
157
-
158
-
159
-
160
-
161
-
162
-
163
-
164
-
165
-
166
-
167
-
168
-
169
-
170
-
171
-
172
-
173
-
174
-
175
-
176
-
177
-
178
-
179
-
180
-
181
-
182
-
183
-
184
-
185
-
186
-
187
-
188
-
189
-
190
-
191
-
192
-
193
-
194
-
195
-
196
-
197
-
198
-
199
-
200
-
201
-
202
-
203
-
204
-
205
-
206
-
207
-
208
-
209
-
210
-
211
-
212
-
213
-
214
-
215
-
 216
216 -
 217
217 -
 218
218 -
 219
219 -
 220
220 -
 221
221 -
 222
222 -
 223
223 -
 224
224 -
 225
225 -
 226
226 -
 227
227 -
 228
228 -
 229
229 -
 230
230 -
 231
231 -
 232
232 -
 233
233 -
 234
234
 |
 |

224
Shareholder information
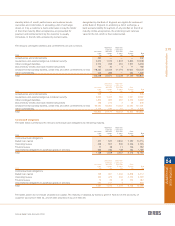
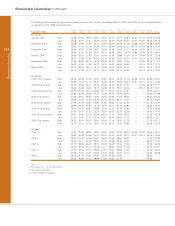
The following table shows the high and low sales prices for each of the outstanding ADSs, X-CAPs and PROs for the periods indicated,
as reported on the NYSE composite tape:
Series D Series E Series F Series G Series H Series I Series J Series K Series L Series M Series A
Figures in US$ ADSs ADSs ADSs ADSs ADSs ADSs ADSs ADSs ADSs ADSs X-CAPs PROs(1)
By month
January 2005 High 26.48 27.40 28.00 25.81 25.70 25.79 26.25 26.84 24.64 26.39 26.93 124.39
Low 26.26 26.96 27.33 25.55 25.45 25.57 25.49 26.37 24.30 26.06 26.09 120.03
December 2004 High 26.68 27.89 27.90 25.92 25.87 26.00 26.08 27.18 24.68 26.16 26.66 122.52
Low 25.89 27.00 27.16 25.39 25.30 25.49 25.64 26.32 24.15 25.76 26.15 117.44
November 2004 High 26.96 28.30 27.78 25.67 25.58 25.88 26.07 27.12 24.45 26.05 26.37 121.24
Low 26.50 27.67 27.25 25.41 25.41 25.45 25.81 26.78 23.89 25.45 26.03 118.07
October 2004 High 26.66 28.35 27.82 25.50 25.44 25.55 25.88 27.04 24.10 25.64 26.16 122.09
Low 26.39 27.56 27.42 25.30 25.31 25.30 25.54 26.75 23.51 25.21 25.72 118.48
September 2004 High 27.45 28.38 28.15 25.75 25.62 25.79 26.40 27.30 — 25.35 26.34 121.77
Low 26.42 27.56 27.45 25.29 25.19 25.29 25.53 26.52 –– 25.15 25.70 117.13
August 2004 High 27.00 28.25 28.10 25.73 25.58 25.62 26.09 27.20 –– 25.17 26.15 118.43
Low 26.73 27.30 27.11 25.31 25.19 25.42 25.74 26.63 –– 25.13 25.72 113.99
By quarter
2004: Fourth quarter High 26.96 28.35 27.90 25.92 25.87 26.00 26.08 27.18 24.68 26.16 26.66 122.52
Low 25.89 27.00 27.16 25.30 25.30 25.30 25.54 26.32 23.51 25.21 25.72 117.44
2004: Third quarter High 27.45 28.38 28.15 25.75 25.62 25.79 26.40 27.30 –– 25.35 26.34 121.77
Low 26.08 26.65 26.65 25.12 24.95 25.20 25.53 26.30 –– 25.13 25.30 112.21
2004: Second quarter High 27.22 29.00 28.10 25.65 25.41 26.00 26.41 27.97 — — 26.02 122.11
Low 25.84 25.90 25.65 24.20 24.45 25.14 25.42 25.70 — — 25.25 110.58
2004: First quarter High 27.90 29.00 28.45 25.90 25.67 26.25 27.05 28.00 — — 26.61 125.14
Low 26.96 27.99 27.65 25.30 25.15 25.70 26.17 27.21 — — 25.74 116.87
2003: Fourth quarter High 27.75 29.16 28.50 25.80 25.85 26.50 27.43 27.90 — — 27.15 120.21
Low 26.86 27.92 27.67 25.25 25.10 25.77 26.35 26.87 — — 26.06 112.70
2003: Third quarter High 28.30 29.15 28.97 25.85 26.04 27.12 27.19 27.84 — — 27.00 123.89
Low 27.24 27.30 27.20 25.23 25.28 25.65 26.30 26.05 — — 26.00 111.06
2003: Second quarter High 29.00 29.20 29.05 25.96 26.35 27.19 27.89 28.20 — — 27.25 130.78
Low 27.25 27.70 27.41 25.16 25.51 26.20 26.94 27.15 — — 26.50 113.27
2003: First quarter High 28.90 29.00 28.12 26.00 26.40 27.40 28.00 27.79 — — 27.15 119.11
Low 26.76 27.01 27.03 25.00 25.35 26.11 26.59 26.85 — — 26.45 113.79
By year
2004 (2) High 27.90 29.00 28.45 25.92 25.87 26.25 27.05 28.00 24.68 26.16 26.66 125.14
Low 25.84 25.90 25.65 24.20 24.45 25.14 25.42 25.70 23.51 25.13 25.25 110.58
2003 (2) High 29.00 29.20 29.05 26.00 26.40 27.40 28.00 28.20 — — 27.25 130.78
Low 26.76 27.01 27.03 25.00 25.10 25.65 26.30 26.05 — — 26.00 111.06
2002 (2) High 27.77 28.20 28.00 25.73 26.05 27.08 27.50 27.30 — — 27.00 116.36
Low 25.74 25.53 25.15 24.46 24.27 24.50 25.45 24.79 — — 25.35 100.07
2001 (2) High 27.99 27.94 27.20 25.86 27.15 27.00 28.85 26.95 — — 27.20 106.44
Low 25.38 25.25 24.31 22.94 22.75 24.63 24.80 22.17 — — 25.50 96.58
2000 (3) High 25.50 25.31 24.63 23.00 22.94 25.00 25.50 — — — 26.00 —
Low 20.63 19.81 19.13 18.88 17.63 19.63 21.13 — — — 21.56 —
Notes:
(1) Price quoted as a % of US$1,000 nominal.
(2) Year ended 31 December.
(3) 15 months ended 31 December.
Shareholder information continued