RBS 2004 Annual Report Download - page 104
Download and view the complete annual report
Please find page 104 of the 2004 RBS annual report below. You can navigate through the pages in the report by either clicking on the pages listed below, or by using the keyword search tool below to find specific information within the annual report.-
 1
1 -
2
-
3
-
4
-
5
-
6
-
7
-
8
-
9
-
10
-
11
-
12
-
13
-
14
-
15
-
16
-
17
-
18
-
19
-
20
-
21
-
22
-
23
-
24
-
25
-
26
-
27
-
28
-
29
-
30
-
31
-
32
-
33
-
34
-
35
-
36
-
37
-
38
-
39
-
40
-
41
-
42
-
43
-
44
-
45
-
46
-
47
-
48
-
49
-
50
-
51
-
52
-
53
-
54
-
55
-
56
-
57
-
58
-
59
-
60
-
61
-
62
-
63
-
64
-
65
-
66
-
67
-
68
-
69
-
70
-
71
-
72
-
73
-
74
-
75
-
76
-
77
-
78
-
79
-
80
-
81
-
82
-
83
-
84
-
85
-
86
-
87
-
88
-
89
-
90
-
91
-
92
-
93
-
 94
94 -
 95
95 -
 96
96 -
 97
97 -
 98
98 -
 99
99 -
 100
100 -
 101
101 -
 102
102 -
 103
103 -
 104
104 -
 105
105 -
 106
106 -
 107
107 -
 108
108 -
 109
109 -
 110
110 -
 111
111 -
 112
112 -
 113
113 -
 114
114 -
115
-
116
-
117
-
118
-
119
-
120
-
121
-
122
-
123
-
124
-
125
-
126
-
127
-
128
-
129
-
130
-
131
-
132
-
133
-
134
-
135
-
136
-
137
-
138
-
139
-
140
-
141
-
142
-
143
-
144
-
145
-
146
-
147
-
148
-
149
-
150
-
151
-
152
-
153
-
154
-
155
-
156
-
157
-
158
-
159
-
160
-
161
-
162
-
163
-
164
-
165
-
166
-
167
-
168
-
169
-
170
-
171
-
172
-
173
-
174
-
175
-
176
-
177
-
178
-
179
-
180
-
181
-
182
-
183
-
184
-
185
-
186
-
187
-
188
-
189
-
190
-
191
-
192
-
193
-
194
-
195
-
196
-
197
-
198
-
199
-
200
-
201
-
202
-
203
-
204
-
205
-
206
-
207
-
208
-
209
-
210
-
211
-
212
-
213
-
214
-
215
-
216
-
217
-
218
-
219
-
220
-
221
-
222
-
223
-
224
-
225
-
226
-
227
-
228
-
229
-
230
-
231
-
232
-
233
-
234
 |
 |

102
Operating and financial review
Operating and financial review continued
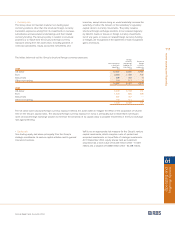
Credit risk (continued)
Specific and general provisions
Provisions fall into one of two categories, specific or general:
•Specific provisions: arise when the creditworthiness of a
borrower has undergone a significant deterioration and the
recovery of the advance is in significant doubt. The amount
of specific provision reflects the financial condition of the
borrower, the realisable value of security and the costs of
recovery.
•General provisions: cover losses that have not yet been
specifically identified but are known from experience to be
present in any portfolio of loans. The level of general
provision reflects the size and diversity of the Group’s loan
portfolio, past experience, the current state of the
economies in which the Group operates and the scope of
specific provisioning procedures.
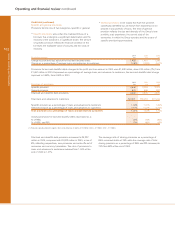
Total bad and doubtful debt provisions increased to £4,222
million in 2004, compared with £3,922 million in 2003, a rise of
8%, reflecting acquisitions, new provisions and write-offs net of
recoveries and currency translations. The ratio of provisions to
loans and advances to customers reduced from 1.53% at the
end of 2003 to 1.21%.
The coverage ratio of closing provisions as a percentage of
REIL remained stable at 76% while the coverage ratio of total
closing provisions as a percentage of REIL and PPL increased to
73% from 68% at the end of 2003.
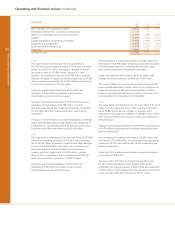
2004 2003 2002
Summary of provisions £m £m £m
Specific provision13,648 3,356 3,323
General provision 574 566 597
Total bad and doubtful debt provisions 4,222 3,922 3,920
Total loans and advances to customers 349,691 256,453 227,244
Specific provision as a percentage of loans and advances to customers 1.04% 1.31% 1.46%
General provision as a percentage of loans and advances to customers 0.17% 0.22% 0.26%
Total provisions as a percentage of loans and advances to customers 1.21% 1.53% 1.72%
Closing provisions for bad and doubtful debts expressed as a:
% of REIL 76% 76% 80%
% of REIL and PPL 73% 68% 65%
(1) Excludes specific provisions against loans and advances to banks of £6 million (2003 – £7 million; 2002 – £7 million)
2004 2003 2002
Provision charge £m £m £m
Charge to profit and loss account for bad and doubtful debts 1,428 1,461 1,286
Charge as a percentage of average loans and advances to customers 0.48% 0.59% 0.61%
Provisions for bad and doubtful debts charged to the profit and loss account in 2004 were £1,428 million, down £33 million (2%) from
£1,461 million in 2003. Expressed as a percentage of average loans and advances to customers, the bad and doubtful debt charge
improved to 0.48%, from 0.59% in 2003.