RBS 2004 Annual Report Download - page 68
Download and view the complete annual report
Please find page 68 of the 2004 RBS annual report below. You can navigate through the pages in the report by either clicking on the pages listed below, or by using the keyword search tool below to find specific information within the annual report.-
 1
1 -
2
-
3
-
4
-
5
-
6
-
7
-
8
-
9
-
10
-
11
-
12
-
13
-
14
-
15
-
16
-
17
-
18
-
19
-
20
-
21
-
22
-
23
-
24
-
25
-
26
-
27
-
28
-
29
-
30
-
31
-
32
-
33
-
34
-
35
-
36
-
37
-
38
-
39
-
40
-
41
-
42
-
43
-
44
-
45
-
46
-
47
-
48
-
49
-
50
-
51
-
52
-
53
-
54
-
55
-
56
-
57
-
 58
58 -
 59
59 -
 60
60 -
 61
61 -
 62
62 -
 63
63 -
 64
64 -
 65
65 -
 66
66 -
 67
67 -
 68
68 -
 69
69 -
 70
70 -
 71
71 -
 72
72 -
 73
73 -
 74
74 -
 75
75 -
 76
76 -
 77
77 -
 78
78 -
79
-
80
-
81
-
82
-
83
-
84
-
85
-
86
-
87
-
88
-
89
-
90
-
91
-
92
-
93
-
94
-
95
-
96
-
97
-
98
-
99
-
100
-
101
-
102
-
103
-
104
-
105
-
106
-
107
-
108
-
109
-
110
-
111
-
112
-
113
-
114
-
115
-
116
-
117
-
118
-
119
-
120
-
121
-
122
-
123
-
124
-
125
-
126
-
127
-
128
-
129
-
130
-
131
-
132
-
133
-
134
-
135
-
136
-
137
-
138
-
139
-
140
-
141
-
142
-
143
-
144
-
145
-
146
-
147
-
148
-
149
-
150
-
151
-
152
-
153
-
154
-
155
-
156
-
157
-
158
-
159
-
160
-
161
-
162
-
163
-
164
-
165
-
166
-
167
-
168
-
169
-
170
-
171
-
172
-
173
-
174
-
175
-
176
-
177
-
178
-
179
-
180
-
181
-
182
-
183
-
184
-
185
-
186
-
187
-
188
-
189
-
190
-
191
-
192
-
193
-
194
-
195
-
196
-
197
-
198
-
199
-
200
-
201
-
202
-
203
-
204
-
205
-
206
-
207
-
208
-
209
-
210
-
211
-
212
-
213
-
214
-
215
-
216
-
217
-
218
-
219
-
220
-
221
-
222
-
223
-
224
-
225
-
226
-
227
-
228
-
229
-
230
-
231
-
232
-
233
-
234
 |
 |

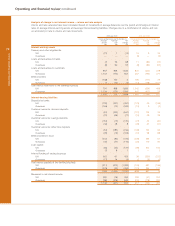
66
Operating and financial review
Operating and financial review continued
Financial highlights
2004 2003* 2002*
for the year ended 31 December £m £m £m
Total income 22,754 19,281 17,016
Profit before tax, goodwill amortisation and integration costs 8,101 7,068 6,540
Profit before tax 6,917 6,076 4,852
Profit attributable to ordinary shareholders 4,256 2,254 2,034
Cost:income ratio (%) (1) 40.8 42.6 44.2
Basic earnings per share (pence) 138.0 76.9 70.6
Adjusted earnings per share (pence) (2) 172.5 157.2 146.3
Dividend cover (times) (3) 2.9 3.1 3.3
Adjusted after-tax return on equity (%) (4) 20.1 20.1 18.3
2004 2003* 2002*
at 31 December £m £m £m
Total assets 583,467 454,428 411,038
Loans and advances to customers 345,469 252,531 223,324
Deposits 384,143 304,286 273,881
Shareholders’ funds 31,865 26,098 25,071
Risk asset ratio – tier 1 (%) 7.0 7.4 7.3
– total (%) 11.7 11.8 11.7
Notes:
(1) Cost:income ratio represents operating expenses excluding goodwill amortisation and integration costs, and after netting operating lease depreciation against rental income,
expressed as a percentage of total income.
(2) Adjusted earnings per share is based on earnings per share adjusted for goodwill amortisation, integration costs and the Additional Value Shares dividend in 2002 and 2003.
(3) Dividend cover represents the total ordinary dividend expressed as a multiple of profit attributable to ordinary shareholders adjusted for goodwill amortisation, integration costs
and the Additional Value Shares dividend in 2002 and 2003.
(4) Adjusted after-tax return on equity is based on profit attributable to ordinary shareholders before goodwill amortisation, integration costs and the Additional Value Shares
dividend in 2002 and 2003, and average equity shareholders’ funds.
* restated (see page 139)