RBS 2004 Annual Report Download - page 207
Download and view the complete annual report
Please find page 207 of the 2004 RBS annual report below. You can navigate through the pages in the report by either clicking on the pages listed below, or by using the keyword search tool below to find specific information within the annual report.-
 1
1 -
2
-
3
-
4
-
5
-
6
-
7
-
8
-
9
-
10
-
11
-
12
-
13
-
14
-
15
-
16
-
17
-
18
-
19
-
20
-
21
-
22
-
23
-
24
-
25
-
26
-
27
-
28
-
29
-
30
-
31
-
32
-
33
-
34
-
35
-
36
-
37
-
38
-
39
-
40
-
41
-
42
-
43
-
44
-
45
-
46
-
47
-
48
-
49
-
50
-
51
-
52
-
53
-
54
-
55
-
56
-
57
-
58
-
59
-
60
-
61
-
62
-
63
-
64
-
65
-
66
-
67
-
68
-
69
-
70
-
71
-
72
-
73
-
74
-
75
-
76
-
77
-
78
-
79
-
80
-
81
-
82
-
83
-
84
-
85
-
86
-
87
-
88
-
89
-
90
-
91
-
92
-
93
-
94
-
95
-
96
-
97
-
98
-
99
-
100
-
101
-
102
-
103
-
104
-
105
-
106
-
107
-
108
-
109
-
110
-
111
-
112
-
113
-
114
-
115
-
116
-
117
-
118
-
119
-
120
-
121
-
122
-
123
-
124
-
125
-
126
-
127
-
128
-
129
-
130
-
131
-
132
-
133
-
134
-
135
-
136
-
137
-
138
-
139
-
140
-
141
-
142
-
143
-
144
-
145
-
146
-
147
-
148
-
149
-
150
-
151
-
152
-
153
-
154
-
155
-
156
-
157
-
158
-
159
-
160
-
161
-
162
-
163
-
164
-
165
-
166
-
167
-
168
-
169
-
170
-
171
-
172
-
173
-
174
-
175
-
176
-
177
-
178
-
179
-
180
-
181
-
182
-
183
-
184
-
185
-
186
-
187
-
188
-
189
-
190
-
191
-
192
-
193
-
194
-
195
-
196
-
 197
197 -
 198
198 -
 199
199 -
 200
200 -
 201
201 -
 202
202 -
 203
203 -
 204
204 -
 205
205 -
 206
206 -
 207
207 -
 208
208 -
 209
209 -
 210
210 -
 211
211 -
 212
212 -
 213
213 -
 214
214 -
 215
215 -
 216
216 -
 217
217 -
218
-
219
-
220
-
221
-
222
-
223
-
224
-
225
-
226
-
227
-
228
-
229
-
230
-
231
-
232
-
233
-
234
 |
 |
section
04
205
Annual Report and Accounts 2004
Additional information
Additional
information
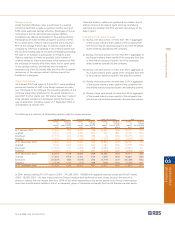
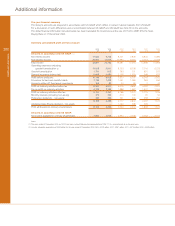
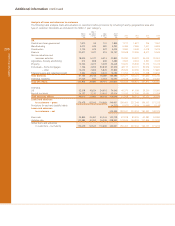
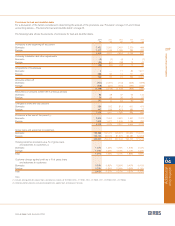
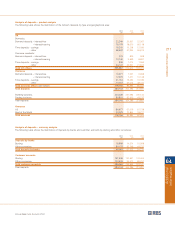
Other financial data
2004 2003 2002 2001 2000
Other financial data based upon UK GAAP (1):
Earnings per ordinary share – pence 138.0 76.9 70.6 67.6 66.9
Diluted earnings per ordinary share – pence (2) 136.9 76.3 69.6 66.3 66.2
Adjusted earnings per ordinary share – pence 172.5 157.2 146.3 127.9 101.2
Dividends per ordinary share – pence 58.0 50.3 43.7 38.0 33.0
Dividend payout ratio 43.2% 66.1% 62.3% 58.1% 56.1%
Share price per ordinary share at period end – £ 17.52 16.46 14.88 16.72 15.82
Market capitalisation at period end – £bn 55.6 48.8 43.2 47.8 42.4
Net asset value per ordinary share – £ 8.62 7.82 7.43 7.79 7.08
Return on average total assets (3) 0.82% 0.51% 0.52% 0.53% 0.58%
Return on average equity shareholders’ funds (4) 16.0% 9.8% 8.8% 8.9% 9.9%
Adjusted return on average equity shareholders’ funds (5) 20.1% 20.1% 18.3% 16.8% 14.9%
Average shareholders’ equity as a percentage
of average total assets 5.7% 5.9% 6.8% 7.2% 7.2%
Risk asset ratio – Tier 1 7.0% 7.4% 7.3% 7.1% 6.9%
Risk asset ratio – Total 11.7% 11.8% 11.7% 11.5% 11.5%
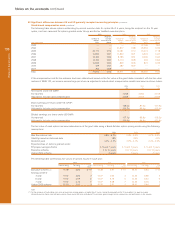
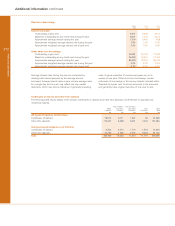
Ratio of earnings to combined fixed charges and preference
share dividends (6)
– including interest on deposits 1.84 1.95 1.74 1.49 1.32
– excluding interest on deposits 7.09 7.08 5.20 4.45 3.49
Ratio of earnings to fixed charges only (6)
– including interest on deposits 1.90 2.04 1.83 1.55 1.37
– excluding interest on deposits 9.26 9.73 7.24 6.52 4.81
Other financial data based upon US GAAP:
Basic earnings per ordinary share – pence 128.0 87.5 107.9 74.7 89.5
Diluted earnings per ordinary share – pence (2) 127.1 86.8 106.3 73.2 88.5
Dividends per ordinary share – pence 52.5 45.6 39.7 34.5 29.8
Dividend payout ratio 40.2% 51.9% 36.7% 45.7% 20.6%
Return on average total assets (3) 0.71% 0.55% 0.75% 0.57% 0.77%
Return on average equity shareholders’ funds (4) 12.8% 9.5% 12.1% 8.8% 12.0%
Average shareholders’ equity as a percentage
of average total assets 6.1% 6.5% 7.3% 7.7% 7.7%
Ratio of earnings to combined fixed charges and preference
share dividends (6)
– including interest on deposits 1.76 1.98 1.97 1.51 1.41
– excluding interest on deposits 6.46 7.24 6.49 4.63 4.19
Ratio of earnings to fixed charges only (6)
– including interest on deposits 1.81 2.07 2.07 1.59 1.46
– excluding interest on deposits 8.44 9.96 9.03 6.98 5.77
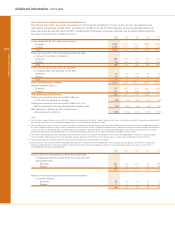
Notes:
(1) The years ended 31 December 2003 and 2002 have been restated following the implementation of FRS 17. It is not practicable to restate prior years.
(2) Convertible preference shares totalling nil (2003 and 2002 – £200 million; 2001 and 2000 – £800 million), nil (2003, 2002, 2001 and 2000 – 750 million) and $1,500 million
(2003, 2002, 2001 and 2000 – $1,900 million) have not been included in the computation of diluted earnings per share as their effect is anti-dilutive.
(3) Return on average total assets represents profit attributable to ordinary shareholders as a percentage of average total assets.
(4) Return on average equity shareholders’ funds represents profit attributable to ordinary shareholders expressed as a percentage of average equity shareholders’ funds.
(5) Adjusted return on average equity shareholders’ funds represents profit attributable to ordinary shareholders before integration costs, goodwill amortisation and the AVS
dividend, expressed as a percentage of average equity shareholders’ funds.
(6) For this purpose, earnings consist of income before tax and minority interests, plus fixed charges less the unremitted income of associated undertakings (share of profits less
dividends received). Fixed charges consist of total interest expense, including or excluding interest on deposits and debt securities in issue, as appropriate, and the proportion
of rental expense deemed representative of the interest factor (one third of total rental expenses).