RBS 2004 Annual Report Download - page 187
Download and view the complete annual report
Please find page 187 of the 2004 RBS annual report below. You can navigate through the pages in the report by either clicking on the pages listed below, or by using the keyword search tool below to find specific information within the annual report.-
 1
1 -
2
-
3
-
4
-
5
-
6
-
7
-
8
-
9
-
10
-
11
-
12
-
13
-
14
-
15
-
16
-
17
-
18
-
19
-
20
-
21
-
22
-
23
-
24
-
25
-
26
-
27
-
28
-
29
-
30
-
31
-
32
-
33
-
34
-
35
-
36
-
37
-
38
-
39
-
40
-
41
-
42
-
43
-
44
-
45
-
46
-
47
-
48
-
49
-
50
-
51
-
52
-
53
-
54
-
55
-
56
-
57
-
58
-
59
-
60
-
61
-
62
-
63
-
64
-
65
-
66
-
67
-
68
-
69
-
70
-
71
-
72
-
73
-
74
-
75
-
76
-
77
-
78
-
79
-
80
-
81
-
82
-
83
-
84
-
85
-
86
-
87
-
88
-
89
-
90
-
91
-
92
-
93
-
94
-
95
-
96
-
97
-
98
-
99
-
100
-
101
-
102
-
103
-
104
-
105
-
106
-
107
-
108
-
109
-
110
-
111
-
112
-
113
-
114
-
115
-
116
-
117
-
118
-
119
-
120
-
121
-
122
-
123
-
124
-
125
-
126
-
127
-
128
-
129
-
130
-
131
-
132
-
133
-
134
-
135
-
136
-
137
-
138
-
139
-
140
-
141
-
142
-
143
-
144
-
145
-
146
-
147
-
148
-
149
-
150
-
151
-
152
-
153
-
154
-
155
-
156
-
157
-
158
-
159
-
160
-
161
-
162
-
163
-
164
-
165
-
166
-
167
-
168
-
169
-
170
-
171
-
172
-
173
-
174
-
175
-
176
-
 177
177 -
 178
178 -
 179
179 -
 180
180 -
 181
181 -
 182
182 -
 183
183 -
 184
184 -
 185
185 -
 186
186 -
 187
187 -
 188
188 -
 189
189 -
 190
190 -
 191
191 -
 192
192 -
 193
193 -
 194
194 -
 195
195 -
 196
196 -
 197
197 -
198
-
199
-
200
-
201
-
202
-
203
-
204
-
205
-
206
-
207
-
208
-
209
-
210
-
211
-
212
-
213
-
214
-
215
-
216
-
217
-
218
-
219
-
220
-
221
-
222
-
223
-
224
-
225
-
226
-
227
-
228
-
229
-
230
-
231
-
232
-
233
-
234
 |
 |
section
03
185
Annual Report and Accounts 2004
Notes on the accounts
Financial
statements
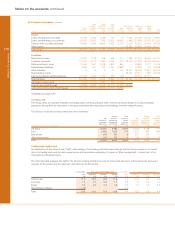
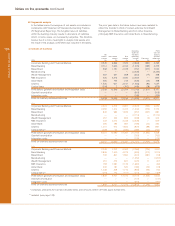
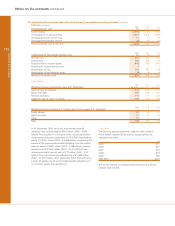
Total assets Net assets
2004 2003* 2004 2003*
£m £m £m £m
Corporate Banking and Financial Markets 346,823 268,523 13,035 11,726
Retail Banking 77,900 67,360 4,269 3,747
Retail Direct 26,862 21,905 1,479 1,236
Manufacturing 5,174 4,259 242 194
Wealth Management 11,751 15,211 580 669
RBS Insurance 10,822 10,124 1,829 1,362
Ulster Bank 27,365 15,560 1,385 988
Citizens 68,262 42,897 10,042 4,395
Central items 8,508 8,589 (996) 1,781
583,467 454,428 31,865 26,098
* restated (see page 139)
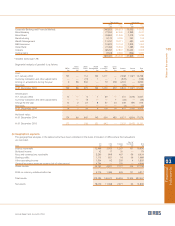
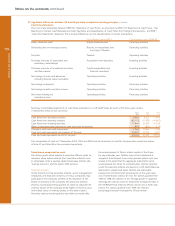
Segmental analysis of goodwill is as follows:
Retail Retail Wealth RBS Ulster
CBFM Banking Direct Management Insurance Bank Citizens Centre Total
£m £m £m £m £m £m £m £m £m
Cost:
At 1 January 2004 191 –– 114 153 1,011 –– 2,668 11,621 15,758
Currency translation and other adjustments –– –– (31) 1 –– 1 (529) –– (558)
Arising on acquisitions during the year 9 98 592 — 19 478 4,703 –– 5,899
Disposals –– –– –– –– –– –– (20) –– (20)
At 31 December 2004 200 98 675 154 1,030 479 6,822 11,621 21,079
Amortisation:
At 1 January 2004 14 –– 6 1 69 –– 331 2,206 2,627
Currency translation and other adjustments –– –– (1) –– –– 1 (35) –– (35)
Charge for the year 12 2 23 8 57 23 209 581 915
Disposals –– –– –– –– –– –– (4) –– (4)
At 31 December 2004 26 2 28 9 126 24 501 2,787 3,503
Net book value:
At 31 December 2004 174 96 647 145 904 455 6,321 8,834 17,576
At 31 December 2003 177 –– 108 152 942 –– 2,337 9,415 13,131
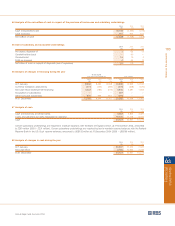
(b) Geographical segments
The geographical analyses in the tables below have been compiled on the basis of location of office where the transactions
are recorded.
Rest of
UK USA Europe the World Total
2004 £m £m £m £m £m
Interest receivable 12,469 2,763 1,267 197 16,696
Dividend income 42 17 20 –– 79
Fees and commissions receivable 5,260 808 467 99 6,634
Dealing profits 1,113 821 18 36 1,988
Other operating income 1,504 92 255 4 1,855
General insurance premium income (net of reinsurance) 4,794 –– 150 –– 4,944
Gross income 25,182 4,501 2,177 336 32,196
Profit on ordinary activities before tax 4,776 1,389 625 127 6,917
Total assets 378,396 145,572 45,593 13,906 583,467
Net assets 18,070 11,068 2,671 56 31,865