RBS 2004 Annual Report Download - page 178
Download and view the complete annual report
Please find page 178 of the 2004 RBS annual report below. You can navigate through the pages in the report by either clicking on the pages listed below, or by using the keyword search tool below to find specific information within the annual report.-
 1
1 -
2
-
3
-
4
-
5
-
6
-
7
-
8
-
9
-
10
-
11
-
12
-
13
-
14
-
15
-
16
-
17
-
18
-
19
-
20
-
21
-
22
-
23
-
24
-
25
-
26
-
27
-
28
-
29
-
30
-
31
-
32
-
33
-
34
-
35
-
36
-
37
-
38
-
39
-
40
-
41
-
42
-
43
-
44
-
45
-
46
-
47
-
48
-
49
-
50
-
51
-
52
-
53
-
54
-
55
-
56
-
57
-
58
-
59
-
60
-
61
-
62
-
63
-
64
-
65
-
66
-
67
-
68
-
69
-
70
-
71
-
72
-
73
-
74
-
75
-
76
-
77
-
78
-
79
-
80
-
81
-
82
-
83
-
84
-
85
-
86
-
87
-
88
-
89
-
90
-
91
-
92
-
93
-
94
-
95
-
96
-
97
-
98
-
99
-
100
-
101
-
102
-
103
-
104
-
105
-
106
-
107
-
108
-
109
-
110
-
111
-
112
-
113
-
114
-
115
-
116
-
117
-
118
-
119
-
120
-
121
-
122
-
123
-
124
-
125
-
126
-
127
-
128
-
129
-
130
-
131
-
132
-
133
-
134
-
135
-
136
-
137
-
138
-
139
-
140
-
141
-
142
-
143
-
144
-
145
-
146
-
147
-
148
-
149
-
150
-
151
-
152
-
153
-
154
-
155
-
156
-
157
-
158
-
159
-
160
-
161
-
162
-
163
-
164
-
165
-
166
-
167
-
 168
168 -
 169
169 -
 170
170 -
 171
171 -
 172
172 -
 173
173 -
 174
174 -
 175
175 -
 176
176 -
 177
177 -
 178
178 -
 179
179 -
 180
180 -
 181
181 -
 182
182 -
 183
183 -
 184
184 -
 185
185 -
 186
186 -
 187
187 -
 188
188 -
189
-
190
-
191
-
192
-
193
-
194
-
195
-
196
-
197
-
198
-
199
-
200
-
201
-
202
-
203
-
204
-
205
-
206
-
207
-
208
-
209
-
210
-
211
-
212
-
213
-
214
-
215
-
216
-
217
-
218
-
219
-
220
-
221
-
222
-
223
-
224
-
225
-
226
-
227
-
228
-
229
-
230
-
231
-
232
-
233
-
234
 |
 |
176
Notes on the accounts
Notes on the accounts continued
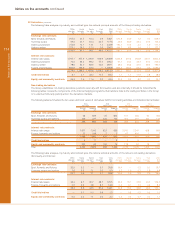
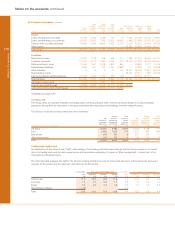
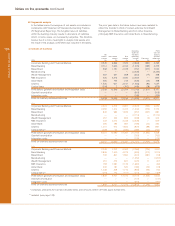
40 Financial instruments (continued)
After After After
3 months 6 months 1 year Non-interest Banking Trading
Within but within but within but within After bearing book book
3 months 6 months 1 year 5 years 5 years funds total total Total
2003* £m £m £m £m £m £m £m £m £m
Assets
Loans and advances to banks 11,149 3,780 5,188 122 32 1,087 21,358 30,533 51,891
Loans and advances to customers 155,920 11,832 7,763 27,992 18,463 1,486 223,456 29,075 252,531
Treasury bills and debt securities 18,906 2,594 4,835 5,525 11,175 2,316 45,351 39,444 84,795
Other assets —————46,583 46,583 18,628 65,211
Total assets 185,975 18,206 17,786 33,639 29,670 51,472 336,748 117,680 454,428
Liabilities
Deposits by banks 37,670 1,178 408 308 414 1,083 41,061 26,262 67,323
Customer accounts 172,563 4,110 2,360 3,352 400 28,140 210,925 26,038 236,963
Debt securities in issue 27,254 2,567 4,428 4,804 846 — 39,899 1,117 41,016
Subordinated liabilities 3,583 601 104 1,762 10,889 — 16,939 59 16,998
Other liabilities 5 5 9 37 126 28,047 28,229 37,801 66,030
Shareholders’ funds —————25,017 25,017 1,081 26,098
Internal funding of trading business (22,447) (1,060) (1,239) (379) (197) — (25,322) 25,322 —
Total liabilities 218,628 7,401 6,070 9,884 12,478 82,287 336,748 117,680 454,428
Off-balance sheet items (7,943) (1,122) 3,597 964 4,504 —
Interest rate sensitivity gap (40,596) 9,683 15,313 24,719 21,696 (30,815)
Cumulative interest rate sensitivity gap (40,596) (30,913) (15,600) 9,119 30,815
*restated (see page 139)
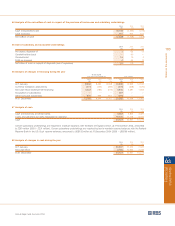
Currency risk
The Group does not maintain material non-trading open currency positions other than the structural foreign currency translation
exposures arising from its investment in overseas subsidiary and associated undertakings and their related funding.
The Group’s structural currency exposures were as follows:
Foreign 2004 Foreign 2003
Net currency Structural Net currency Structural
investments borrowings foreign investments borrowings foreign
in overseas hedging net currency in overseas hedging net currency
operations investments exposures operations investments exposures
Functional currency of net investment £m £m £m £m £m £m
US dollar 12,367 6,580 5,787 5,329 5,198 131
Euro 2,086 1,349 737 1,422 826 596
Swiss franc 398 392 6 357 357 —
Other non-sterling 116 112 4 118 114 4
Total 14,967 8,433 6,534 7,226 6,495 731
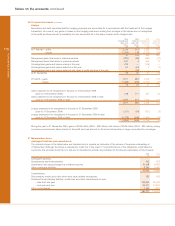
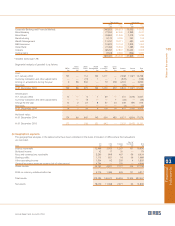
Trading book market risk
An explanation of the value-at-risk (“VaR”) methodology of estimating potential losses arising from the Group’s exposure to market
risk in its trading book and the main assumptions and parameters underlying it is given in ‘Risk management – market risk’ in the
Operating and financial review.
The following table analyses the VaR for the Group’s trading portfolios by type of market risk exposure at the period end and as an
average for the period and the maximum and minimum for the period:
31 December Year ended 31 December 2004 31 December Year ended 31 December 2003
2004 Maximum Minimum Average 2003 Maximum Minimum Average
£m £m £m £m £m £m £m £m
Interest rate 11.2 16.5 6.9 11.5 7.4 14.5 5.7 9.4
Currency 1.2 2.7 0.5 1.1 0.8 2.5 0.7 1.3
Equity 0.2 2.0 0.2 0.6 0.4 1.4 0.2 0.5
Diversification effects (2.3) (1.2)
Total 10.3 16.0 6.4 10.8 7.4 14.2 5.6 9.4