RBS 2004 Annual Report Download - page 75
Download and view the complete annual report
Please find page 75 of the 2004 RBS annual report below. You can navigate through the pages in the report by either clicking on the pages listed below, or by using the keyword search tool below to find specific information within the annual report.-
 1
1 -
2
-
3
-
4
-
5
-
6
-
7
-
8
-
9
-
10
-
11
-
12
-
13
-
14
-
15
-
16
-
17
-
18
-
19
-
20
-
21
-
22
-
23
-
24
-
25
-
26
-
27
-
28
-
29
-
30
-
31
-
32
-
33
-
34
-
35
-
36
-
37
-
38
-
39
-
40
-
41
-
42
-
43
-
44
-
45
-
46
-
47
-
48
-
49
-
50
-
51
-
52
-
53
-
54
-
55
-
56
-
57
-
58
-
59
-
60
-
61
-
62
-
63
-
64
-
 65
65 -
 66
66 -
 67
67 -
 68
68 -
 69
69 -
 70
70 -
 71
71 -
 72
72 -
 73
73 -
 74
74 -
 75
75 -
 76
76 -
 77
77 -
 78
78 -
 79
79 -
 80
80 -
 81
81 -
 82
82 -
 83
83 -
 84
84 -
 85
85 -
86
-
87
-
88
-
89
-
90
-
91
-
92
-
93
-
94
-
95
-
96
-
97
-
98
-
99
-
100
-
101
-
102
-
103
-
104
-
105
-
106
-
107
-
108
-
109
-
110
-
111
-
112
-
113
-
114
-
115
-
116
-
117
-
118
-
119
-
120
-
121
-
122
-
123
-
124
-
125
-
126
-
127
-
128
-
129
-
130
-
131
-
132
-
133
-
134
-
135
-
136
-
137
-
138
-
139
-
140
-
141
-
142
-
143
-
144
-
145
-
146
-
147
-
148
-
149
-
150
-
151
-
152
-
153
-
154
-
155
-
156
-
157
-
158
-
159
-
160
-
161
-
162
-
163
-
164
-
165
-
166
-
167
-
168
-
169
-
170
-
171
-
172
-
173
-
174
-
175
-
176
-
177
-
178
-
179
-
180
-
181
-
182
-
183
-
184
-
185
-
186
-
187
-
188
-
189
-
190
-
191
-
192
-
193
-
194
-
195
-
196
-
197
-
198
-
199
-
200
-
201
-
202
-
203
-
204
-
205
-
206
-
207
-
208
-
209
-
210
-
211
-
212
-
213
-
214
-
215
-
216
-
217
-
218
-
219
-
220
-
221
-
222
-
223
-
224
-
225
-
226
-
227
-
228
-
229
-
230
-
231
-
232
-
233
-
234
 |
 |

section
01
Operating and
financial review
73
Annual Report and Accounts 2004
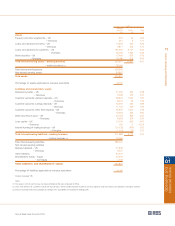
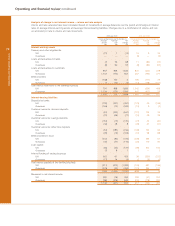
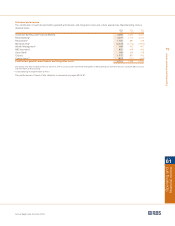
Operating and financial review
2002*
Average
balance Interest Rate
£m £m %
Assets
Treasury and other eligible bills – UK 910 24 2.64
Treasury and other eligible bills – Overseas 351 6 1.71
Loans and advances to banks – UK 13,439 532 3.96
Loans and advances to banks – Overseas 9,811 304 3.10
Loans and advances to customers – UK 154,202 9,141 5.93
Loans and advances to customers – Overseas 35,759 1,963 5.49
Debt securities – UK 17,950 675 3.76
Debt securities – Overseas 18,188 916 5.04
Total interest-earning assets – banking business 250,610 13,561 5.41
– trading business (3) 78,380
Total interest-earning assets 328,990
Non-interest-earning assets 64,867
Total assets 393,857
Percentage of assets applicable to overseas operations 32.0%
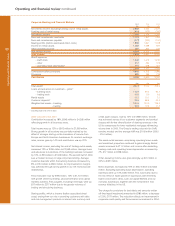
Liabilities and shareholders’ equity
Deposits by banks – UK 21,090 544 2.58
Deposits by banks – Overseas 9,058 215 2.37
Customer accounts: demand deposits – UK 58,618 1,062 1.81
Customer accounts: demand deposits – Overseas 8,275 99 1.20
Customer accounts: savings deposits – UK 16,002 463 2.89
Customer accounts: savings deposits – Overseas 11,742 229 1.95
Customer accounts: other time deposits – UK 45,902 1,542 3.36
Customer accounts: other time deposits – Overseas 16,264 462 2.84
Debt securities in issue – UK 24,154 965 4.00
Debt securities in issue – Overseas 8,693 209 2.40
Loan capital – UK 13,154 640 4.87
Loan capital – Overseas 166 17 10.24
Internal funding of trading business – UK (20,129) (709) 3.52
Internal funding of trading business – Overseas (1,301) (26) 2.00
Total interest-bearing liabilities – banking business 211,688 5,712 2.70
– trading business (3) 75,059
Total interest-bearing liabilities 286,747
Non-interest-bearing liabilities
Demand deposits – UK 21,848
Demand deposits – Overseas 6,401
Other liabilities 52,047
Shareholders’ funds – equity 23,075
Shareholders’ funds – non-equity 3,739
Total liabilities and shareholders’ equity 393,857
Percentage of liabilities applicable to overseas operations 30.4%
* restated (see page 139)
Notes:
(1) The analysis into UK and Overseas has been compiled on the basis of location of office.
(2) Loans and advances to customers include non-accrual loans. Interest income includes income on non-accruing loans only to the extent cash payments have been received.
(3) Interest receivable and interest payable on trading assets and liabilities are included in dealing profits.