RBS 2004 Annual Report Download - page 175
Download and view the complete annual report
Please find page 175 of the 2004 RBS annual report below. You can navigate through the pages in the report by either clicking on the pages listed below, or by using the keyword search tool below to find specific information within the annual report.-
 1
1 -
2
-
3
-
4
-
5
-
6
-
7
-
8
-
9
-
10
-
11
-
12
-
13
-
14
-
15
-
16
-
17
-
18
-
19
-
20
-
21
-
22
-
23
-
24
-
25
-
26
-
27
-
28
-
29
-
30
-
31
-
32
-
33
-
34
-
35
-
36
-
37
-
38
-
39
-
40
-
41
-
42
-
43
-
44
-
45
-
46
-
47
-
48
-
49
-
50
-
51
-
52
-
53
-
54
-
55
-
56
-
57
-
58
-
59
-
60
-
61
-
62
-
63
-
64
-
65
-
66
-
67
-
68
-
69
-
70
-
71
-
72
-
73
-
74
-
75
-
76
-
77
-
78
-
79
-
80
-
81
-
82
-
83
-
84
-
85
-
86
-
87
-
88
-
89
-
90
-
91
-
92
-
93
-
94
-
95
-
96
-
97
-
98
-
99
-
100
-
101
-
102
-
103
-
104
-
105
-
106
-
107
-
108
-
109
-
110
-
111
-
112
-
113
-
114
-
115
-
116
-
117
-
118
-
119
-
120
-
121
-
122
-
123
-
124
-
125
-
126
-
127
-
128
-
129
-
130
-
131
-
132
-
133
-
134
-
135
-
136
-
137
-
138
-
139
-
140
-
141
-
142
-
143
-
144
-
145
-
146
-
147
-
148
-
149
-
150
-
151
-
152
-
153
-
154
-
155
-
156
-
157
-
158
-
159
-
160
-
161
-
162
-
163
-
164
-
 165
165 -
 166
166 -
 167
167 -
 168
168 -
 169
169 -
 170
170 -
 171
171 -
 172
172 -
 173
173 -
 174
174 -
 175
175 -
 176
176 -
 177
177 -
 178
178 -
 179
179 -
 180
180 -
 181
181 -
 182
182 -
 183
183 -
 184
184 -
 185
185 -
186
-
187
-
188
-
189
-
190
-
191
-
192
-
193
-
194
-
195
-
196
-
197
-
198
-
199
-
200
-
201
-
202
-
203
-
204
-
205
-
206
-
207
-
208
-
209
-
210
-
211
-
212
-
213
-
214
-
215
-
216
-
217
-
218
-
219
-
220
-
221
-
222
-
223
-
224
-
225
-
226
-
227
-
228
-
229
-
230
-
231
-
232
-
233
-
234
 |
 |

section
03
173
Annual Report and Accounts 2004
Notes on the accounts
Financial
statements
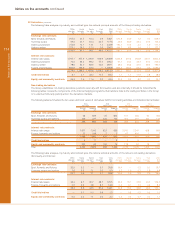
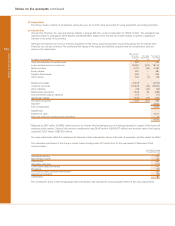
Maturity of replacement cost of over-the-counter contracts (trading and non-trading)
Replacement cost indicates the Group’s derivatives credit exposure. The following table sets forth the gross positive fair values by
maturity. The net replacement cost of internal trades is not included as there is no credit risk associated with them.
Within One to Two to Over 2004 Within One to Two to Over 2003
one year two years five years five years Total one year two years five years five years Total
£m £m £m £m £m £m £m £m £m £m
Before netting:
Exchange rate contracts 21,812 2,369 3,045 2,018 29,244 22,315 2,245 2,028 1,575 28,163
Interest rate contracts 6,781 7,447 17,501 27,304 59,033 8,440 7,401 17,462 21,671 54,974
Credit derivatives –– 15 92 157 264 11 7 85 169 272
Equity and commodity contracts 623 130 675 13 1,441 102 590 319 9 1,020
29,216 9,961 21,313 29,492 89,982 30,868 10,243 19,894 23,424 84,429
Banks and investment firms 70,501 70,421
Others 19,481 14,008
89,982 84,429
At 31 December 2004, the potential credit risk exposure, which is after netting and allowing for collateral received, of the Group’s
trading and non-trading derivatives, was £6,290 million (2003 – £5,405 million) to banks and investment firms and £7,900 million
(2003 – £5,985 million) to other counterparties.
Exchange traded contracts are excluded from the above table. Such contracts generally involve lower credit risk than OTC contracts
as they are cleared through exchanges that require margin from participants and the daily settlement of gains and losses.
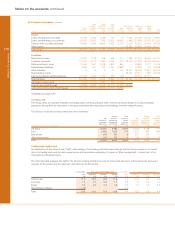
Trading derivatives
The following table shows the fair values of instruments in the derivatives trading portfolio:
2004 2003
End of period fair value End of period fair value
Assets Liabilities Assets Liabilities
£m £m £m £m
Exchange rate contracts:
Spot, forwards and futures 17,133 18,566 18,299 20,325
Currency swaps 6,281 6,314 5,183 4,944
Options purchased 5,797 –– 4,620 —
Options written — 5,324 — 4,295
29,211 30,204 28,102 29,564
Interest rate contracts:
Interest rate swaps 55,001 55,360 50,838 50,744
Options purchased 3,168 –– 2,799 —
Options written — 3,274 — 2,829
Futures and forwards 475 479 629 639
58,644 59,113 54,266 54,212
Credit derivatives 264 285 273 155
Equity and commodity contracts 1,274 941 924 720
89,393 90,543 83,565 84,651
Netting (71,509) (71,509) (69,478) (69,478)
17,884 19,034 14,087 15,173
Average fair values (before netting):
Exchange rate contracts 20,050 21,193 18,967 19,619
Interest rate contracts 55,548 56,258 65,676 65,977
Credit derivatives 219 177 365 133
Equity and commodity contracts 1,325 920 877 624
77,142 78,548 85,885 86,353
Gains and losses on exchange traded contracts subject to daily margining requirements are settled daily. The fair value of such
contracts included above reflects the last day’s variation margin.