RBS 2004 Annual Report Download - page 213
Download and view the complete annual report
Please find page 213 of the 2004 RBS annual report below. You can navigate through the pages in the report by either clicking on the pages listed below, or by using the keyword search tool below to find specific information within the annual report.-
 1
1 -
2
-
3
-
4
-
5
-
6
-
7
-
8
-
9
-
10
-
11
-
12
-
13
-
14
-
15
-
16
-
17
-
18
-
19
-
20
-
21
-
22
-
23
-
24
-
25
-
26
-
27
-
28
-
29
-
30
-
31
-
32
-
33
-
34
-
35
-
36
-
37
-
38
-
39
-
40
-
41
-
42
-
43
-
44
-
45
-
46
-
47
-
48
-
49
-
50
-
51
-
52
-
53
-
54
-
55
-
56
-
57
-
58
-
59
-
60
-
61
-
62
-
63
-
64
-
65
-
66
-
67
-
68
-
69
-
70
-
71
-
72
-
73
-
74
-
75
-
76
-
77
-
78
-
79
-
80
-
81
-
82
-
83
-
84
-
85
-
86
-
87
-
88
-
89
-
90
-
91
-
92
-
93
-
94
-
95
-
96
-
97
-
98
-
99
-
100
-
101
-
102
-
103
-
104
-
105
-
106
-
107
-
108
-
109
-
110
-
111
-
112
-
113
-
114
-
115
-
116
-
117
-
118
-
119
-
120
-
121
-
122
-
123
-
124
-
125
-
126
-
127
-
128
-
129
-
130
-
131
-
132
-
133
-
134
-
135
-
136
-
137
-
138
-
139
-
140
-
141
-
142
-
143
-
144
-
145
-
146
-
147
-
148
-
149
-
150
-
151
-
152
-
153
-
154
-
155
-
156
-
157
-
158
-
159
-
160
-
161
-
162
-
163
-
164
-
165
-
166
-
167
-
168
-
169
-
170
-
171
-
172
-
173
-
174
-
175
-
176
-
177
-
178
-
179
-
180
-
181
-
182
-
183
-
184
-
185
-
186
-
187
-
188
-
189
-
190
-
191
-
192
-
193
-
194
-
195
-
196
-
197
-
198
-
199
-
200
-
201
-
202
-
 203
203 -
 204
204 -
 205
205 -
 206
206 -
 207
207 -
 208
208 -
 209
209 -
 210
210 -
 211
211 -
 212
212 -
 213
213 -
 214
214 -
 215
215 -
 216
216 -
 217
217 -
 218
218 -
 219
219 -
 220
220 -
 221
221 -
 222
222 -
 223
223 -
224
-
225
-
226
-
227
-
228
-
229
-
230
-
231
-
232
-
233
-
234
 |
 |
section
04
211
Annual Report and Accounts 2004
Additional information
Additional
information
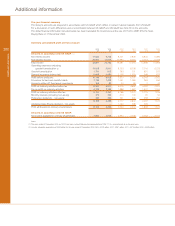
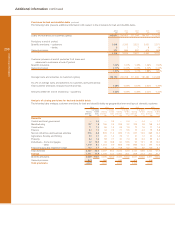
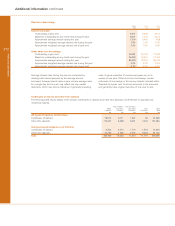
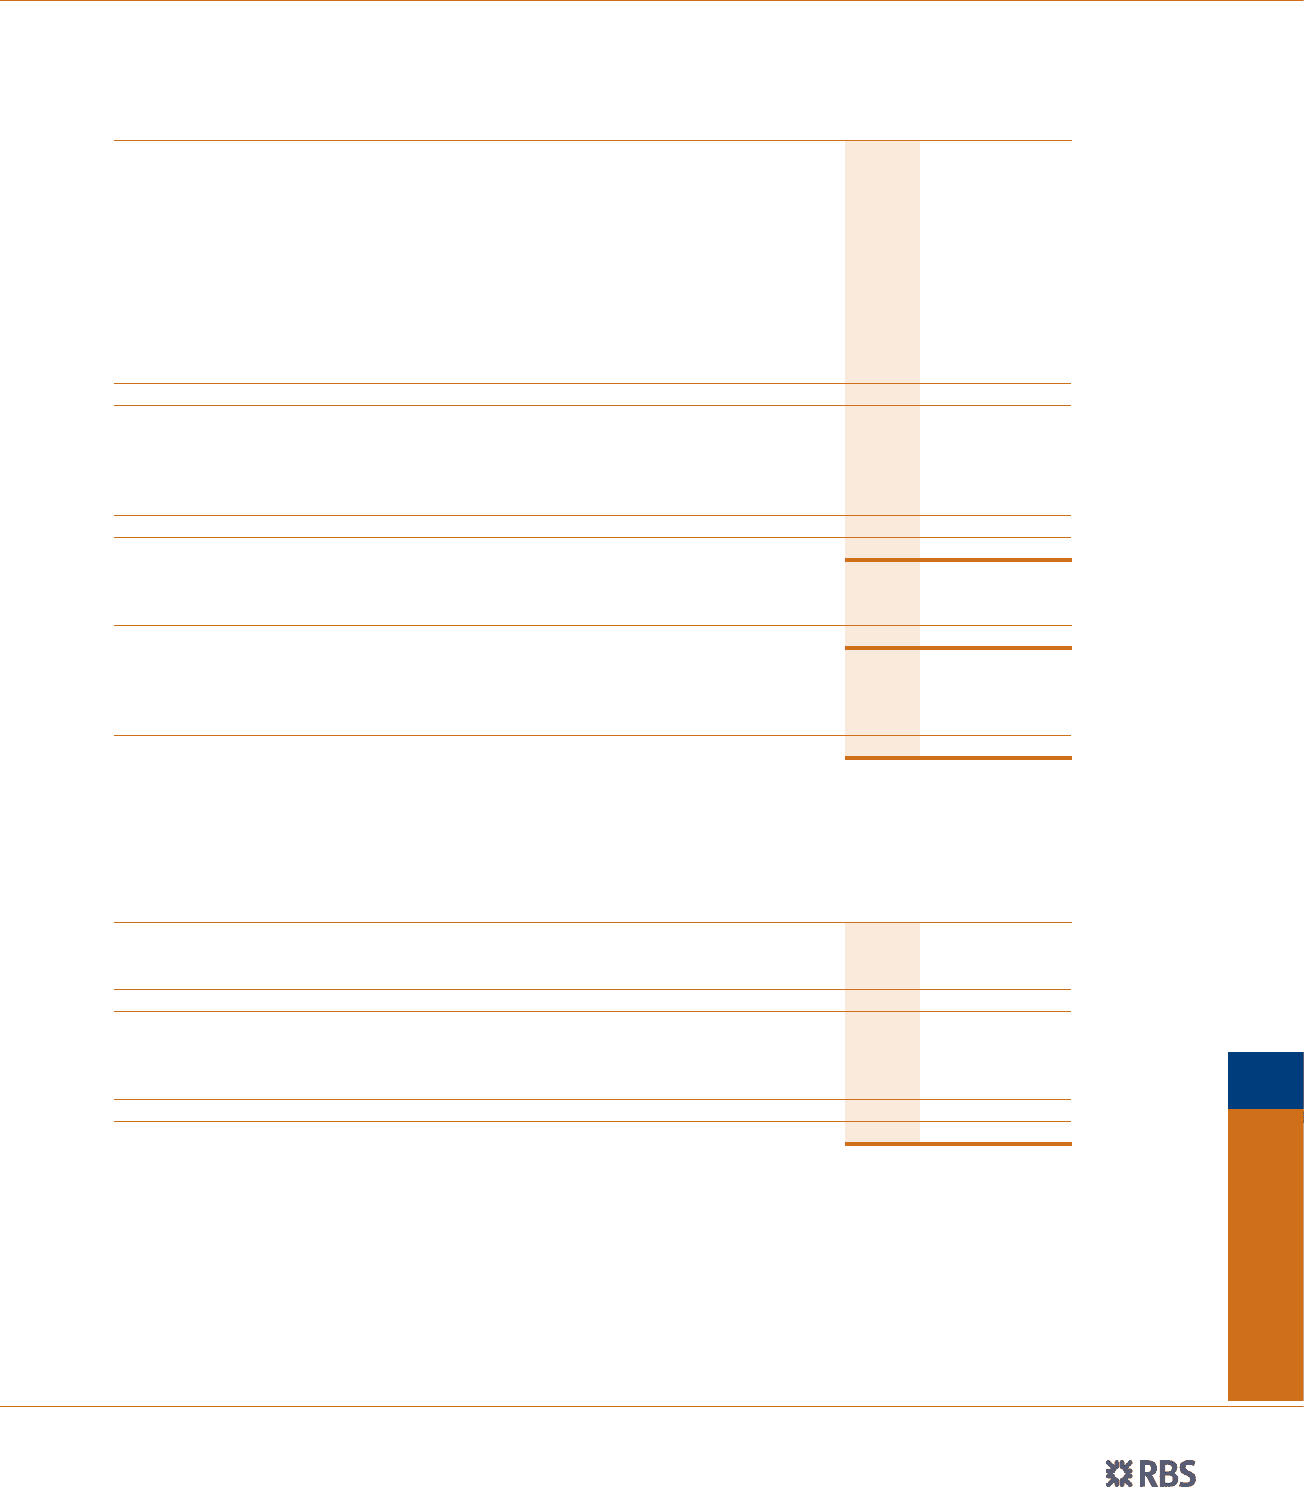
Analysis of deposits – product analysis
The following table shows the distribution of the Group’s deposits by type and geographical area:
2004 2003 2002
£m £m £m
UK
Domestic:
Demand deposits – interest-free 22,249 20,567 22,067
Demand deposits – interest-bearing 78,178 78,670 66,118
Time deposits – savings 18,205 13,238 12,180
Time deposits – other 68,662 57,994 59,819
Overseas residents:
Demand deposits – interest-free 376 830 908
Demand deposits – interest-bearing 12,740 9,559 8,897
Time deposits – savings 836 1,014 1,559
Time deposits – other 64,141 32,531 21,824
Total UK offices 265,387 214,403 193,372
Overseas
Demand deposits – interest-free 10,371 7,937 6,698
Demand deposits – interest-bearing 12,975 7,471 10,148
Time deposits – savings 21,153 15,450 15,189
Time deposits – other 74,257 59,025 48,474
Total overseas offices (see below) 118,756 89,883 80,509
Total deposits 384,143 304,286 273,881
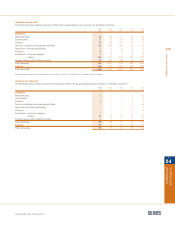
Banking business 303,328 251,986 230,144
Trading business 80,815 52,300 43,737
Total deposits 384,143 304,286 273,881
Overseas
US 86,677 67,019 61,738
Rest of the World 32,079 22,864 18,771
Total overseas 118,756 89,883 80,509
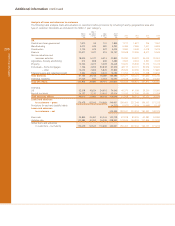
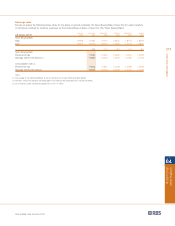
Analysis of deposits – currency analysis
The following table shows the distribution of deposits by banks and customer accounts by sterling and other currencies:
2004 2003 2002
£m £m £m
Deposits by banks
Sterling 18,958 14,574 10,998
Other currencies 80,123 52,749 43,722
Total deposits by banks 99,081 67,323 54,720
Customer accounts
Sterling 161,636 142,551 133,404
Other currencies 123,426 94,412 85,757
Total customer accounts 285,062 236,963 219,161
Total deposits 384,143 304,286 273,881