RBS 2004 Annual Report Download - page 195
Download and view the complete annual report
Please find page 195 of the 2004 RBS annual report below. You can navigate through the pages in the report by either clicking on the pages listed below, or by using the keyword search tool below to find specific information within the annual report.-
 1
1 -
2
-
3
-
4
-
5
-
6
-
7
-
8
-
9
-
10
-
11
-
12
-
13
-
14
-
15
-
16
-
17
-
18
-
19
-
20
-
21
-
22
-
23
-
24
-
25
-
26
-
27
-
28
-
29
-
30
-
31
-
32
-
33
-
34
-
35
-
36
-
37
-
38
-
39
-
40
-
41
-
42
-
43
-
44
-
45
-
46
-
47
-
48
-
49
-
50
-
51
-
52
-
53
-
54
-
55
-
56
-
57
-
58
-
59
-
60
-
61
-
62
-
63
-
64
-
65
-
66
-
67
-
68
-
69
-
70
-
71
-
72
-
73
-
74
-
75
-
76
-
77
-
78
-
79
-
80
-
81
-
82
-
83
-
84
-
85
-
86
-
87
-
88
-
89
-
90
-
91
-
92
-
93
-
94
-
95
-
96
-
97
-
98
-
99
-
100
-
101
-
102
-
103
-
104
-
105
-
106
-
107
-
108
-
109
-
110
-
111
-
112
-
113
-
114
-
115
-
116
-
117
-
118
-
119
-
120
-
121
-
122
-
123
-
124
-
125
-
126
-
127
-
128
-
129
-
130
-
131
-
132
-
133
-
134
-
135
-
136
-
137
-
138
-
139
-
140
-
141
-
142
-
143
-
144
-
145
-
146
-
147
-
148
-
149
-
150
-
151
-
152
-
153
-
154
-
155
-
156
-
157
-
158
-
159
-
160
-
161
-
162
-
163
-
164
-
165
-
166
-
167
-
168
-
169
-
170
-
171
-
172
-
173
-
174
-
175
-
176
-
177
-
178
-
179
-
180
-
181
-
182
-
183
-
184
-
 185
185 -
 186
186 -
 187
187 -
 188
188 -
 189
189 -
 190
190 -
 191
191 -
 192
192 -
 193
193 -
 194
194 -
 195
195 -
 196
196 -
 197
197 -
 198
198 -
 199
199 -
 200
200 -
 201
201 -
 202
202 -
 203
203 -
 204
204 -
 205
205 -
206
-
207
-
208
-
209
-
210
-
211
-
212
-
213
-
214
-
215
-
216
-
217
-
218
-
219
-
220
-
221
-
222
-
223
-
224
-
225
-
226
-
227
-
228
-
229
-
230
-
231
-
232
-
233
-
234
 |
 |

section
03
193
Annual Report and Accounts 2004
Notes on the accounts
Financial
statements
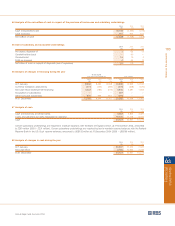
Loan impairment
At 31 December 2004 and 2003, the Group estimated that
the difference between the carrying value of its loan portfolio
under US GAAP and its value in the Group’s UK GAAP financial
statements was such that no adjustment to net income or
consolidated shareholders’ equity was required. At 31
December 2004, the Group’s non-accrual loans, loans past
due 90 days and troubled debt restructurings amounted to
£5,529 million (2003 – £5,157 million). Specific provisions
of £3,602 million (2003 – £2,782 million) were held against
these loans. Average non-accrual loans, loans past due
90 days and troubled debt restructurings for the year to 31
December 2004 were £5,313 million (2003 – £5,166 million).
Gross interest income not recognised, but which would have
been recognised under the original terms of non-accrual and
restructured loans, amounted to £237 million for the year
ended 31 December 2004 (2003 – £237 million; 2002 – £234
million) from domestic loans and £58 million for the year ended
31 December 2004 (2003 – £55 million; 2002 – £73 million)
from foreign loans. Interest on non-accrual and restructured
loans included in net income was £58 million for the year
ended 31 December 2004 (2003 – £60 million; 2002 – £47
million) from domestic loans and £7 million for the year ended
31 December 2004 (2003 – £3 million; 2002 – £7 million) from
foreign loans.
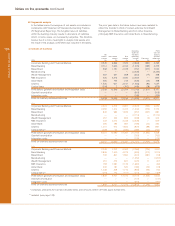
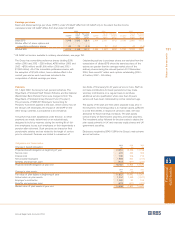
Securities
During 2004, net gains of £2 million were included in US GAAP
net income from transfers of securities from the available-for-
sale category into the trading category. For 2004, net unrealised
losses of £924 million on available-for-sale securities were
included in US GAAP other comprehensive income and £672
million was reclassified from accumulated other comprehensive
income into US GAAP net income.
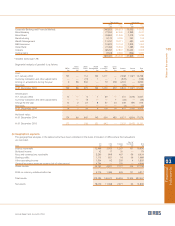
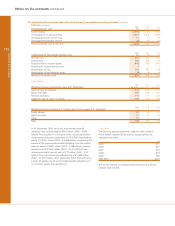
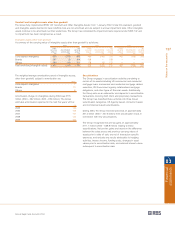
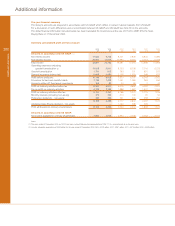
The table below shows the fair value of available-for-sale securities that were in an unrealised loss position at 31 December 2004.
Less than 12 months More than 12 months Total
Gross Gross Gross
unrealised unrealised unrealised
Number Fair value losses Fair value losses Fair value losses
Issued by of issues £m £m £m £m £m £m
UK government — — 512 20 512 20
US treasury and government and
securities issued by US states 507 24 — — 507 24
Other government 855 18 47 2 902 20
Corporate debt securities 73 4 75 5 148 9
Mortgage-backed securities 3,651 66 906 28 4,557 94
Bank and building society 29 4 51 1 80 5
Other 8 1 — — 8 1
Available-for-sale debt securities 516 5,123 117 1,591 56 6,714 173
The Group considers that unrealised losses on available-for-sale debt securities are temporary principally because they reflect
changes in benchmark interest rates. In 2004, other than temporary losses of £78 million have been recognised in net income on
available-for-sale equity shares.