RBS 2004 Annual Report Download - page 112
Download and view the complete annual report
Please find page 112 of the 2004 RBS annual report below. You can navigate through the pages in the report by either clicking on the pages listed below, or by using the keyword search tool below to find specific information within the annual report.-
 1
1 -
2
-
3
-
4
-
5
-
6
-
7
-
8
-
9
-
10
-
11
-
12
-
13
-
14
-
15
-
16
-
17
-
18
-
19
-
20
-
21
-
22
-
23
-
24
-
25
-
26
-
27
-
28
-
29
-
30
-
31
-
32
-
33
-
34
-
35
-
36
-
37
-
38
-
39
-
40
-
41
-
42
-
43
-
44
-
45
-
46
-
47
-
48
-
49
-
50
-
51
-
52
-
53
-
54
-
55
-
56
-
57
-
58
-
59
-
60
-
61
-
62
-
63
-
64
-
65
-
66
-
67
-
68
-
69
-
70
-
71
-
72
-
73
-
74
-
75
-
76
-
77
-
78
-
79
-
80
-
81
-
82
-
83
-
84
-
85
-
86
-
87
-
88
-
89
-
90
-
91
-
92
-
93
-
94
-
95
-
96
-
97
-
98
-
99
-
100
-
101
-
 102
102 -
 103
103 -
 104
104 -
 105
105 -
 106
106 -
 107
107 -
 108
108 -
 109
109 -
 110
110 -
 111
111 -
 112
112 -
 113
113 -
 114
114 -
 115
115 -
 116
116 -
 117
117 -
 118
118 -
 119
119 -
 120
120 -
 121
121 -
 122
122 -
123
-
124
-
125
-
126
-
127
-
128
-
129
-
130
-
131
-
132
-
133
-
134
-
135
-
136
-
137
-
138
-
139
-
140
-
141
-
142
-
143
-
144
-
145
-
146
-
147
-
148
-
149
-
150
-
151
-
152
-
153
-
154
-
155
-
156
-
157
-
158
-
159
-
160
-
161
-
162
-
163
-
164
-
165
-
166
-
167
-
168
-
169
-
170
-
171
-
172
-
173
-
174
-
175
-
176
-
177
-
178
-
179
-
180
-
181
-
182
-
183
-
184
-
185
-
186
-
187
-
188
-
189
-
190
-
191
-
192
-
193
-
194
-
195
-
196
-
197
-
198
-
199
-
200
-
201
-
202
-
203
-
204
-
205
-
206
-
207
-
208
-
209
-
210
-
211
-
212
-
213
-
214
-
215
-
216
-
217
-
218
-
219
-
220
-
221
-
222
-
223
-
224
-
225
-
226
-
227
-
228
-
229
-
230
-
231
-
232
-
233
-
234
 |
 |

110
Operating and financial review
Operating and financial review continued
Market risk (continued)
Non-trading (continued)
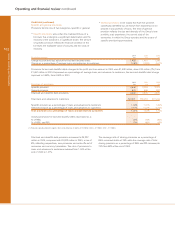
Non-trading interest rate VaR
Non-trading interest rate VaR for the Group’s treasury and retail
and corporate banking activities was £72.4 million at 31
December 2004 (2003 – £78.1 million) with the major exposure
being to changes in longer term US dollar interest rates.
During the year, the maximum VaR was £89.7 million (2003 –
£78.1 million), the minimum £51.5 million (2003 – £29.9 million)
and the average £71.2 million (2003 – £51.7 million).
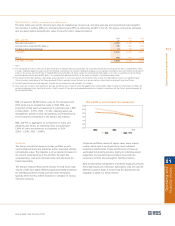
Citizens was the main contributor to the Group’s non-trading
interest rate VaR. It invests its surplus retail deposits in a
portfolio of highly rated and liquid investments principally
mortgage-backed securities. This balance sheet management
approach is common for US retail banks where mortgages are
originated and then sold to Federal agencies for funding
through the capital markets. The significant increase in VaR
during 2003 and 2004 reflects substantial growth in retail
deposits in Citizens and asset growth in home equity loans and
mortgage backed securities both organically and through
acquisition. VaR, like all interest rate risk measures, has its
limitations when applied to retail banking books and the
management of Citizens’ interest rate exposures involves a
number of other interest rate risk measures and related limits.
Two measures that are reported both to Citizens ALCO and
Board are:
•the sensitivity of their net interest income to a series of
parallel movements in interest rates; and
•economic value of equity (“EVE”) limits.
These limits are set to parallel movements of +/-1% and +/-2%.
The EVE methodology captures deposit re-pricing strategies
and the embedded option risks that exists within both the
investment portfolio of mortgage-backed securities and the
consumer loan portfolio. EVE is the present value of the cash
flows generated by the current balance sheet. EVE sensitivity
to a 2% parallel movement upwards and downwards in US
interest rates is shown below.
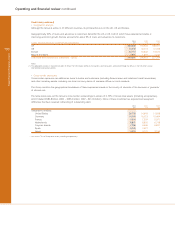
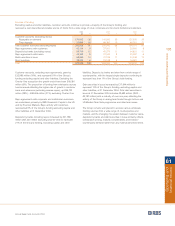
Percent increase/(decrease) in Citizens EVE
2% parallel upward 2% parallel downward
movement in movement in US interest rates
US interest rates (no negative rates allowed)
2004 % %
Period end (9.2) (4.4)
Maximum (12.6) (18.5)
Minimum (5.2) (4.4)
Average (9.3) (9.2)
Percent increase/(decrease) in Citizens EVE
2% parallel upward 2% parallel downward
movement in movement in US interest rates
US interest rates (no negative rates allowed)
2003 % %
Period end (9.4) (8.8)
Maximum (11.4) (14.2)
Minimum 3.2 (0.6)
Average (4.4) (6.4)
At Group level, the other major structural interest rate risk
arises from a low interest rate environment, particularly in
sterling, sustained for a number of years. In such a scenario
deposit pricing may reach effective floors below which it is not
reasonable to reduce rates further whilst variable rate asset
pricing continues to decline. A sustained low rate scenario
would also generate progressively reduced income from the
medium and long term hedging of non-interest bearing
liabilities. GALCO regularly reviews the impact of successive
declines in rates to ensure that appropriate risk management
strategies are employed. This may involve execution of
derivatives, product development and tactical pricing changes.
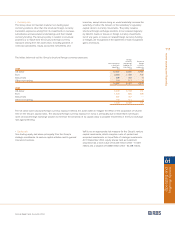
Note 40 on the accounts includes, on pages 175 and 176,
tables that summarise the Group’s interest rate sensitivity gap
for its non-trading book at 31 December 2004 and 31 December
2003. The tables show the contractual re-pricing for each
category of asset, liability and for off-balance sheet items and
do not reflect the behaviouralised repricing used in the Group’s
asset and liability management methodology and the non-
trading interest rate VaR presented above.