RBS 2004 Annual Report Download - page 88
Download and view the complete annual report
Please find page 88 of the 2004 RBS annual report below. You can navigate through the pages in the report by either clicking on the pages listed below, or by using the keyword search tool below to find specific information within the annual report.-
 1
1 -
2
-
3
-
4
-
5
-
6
-
7
-
8
-
9
-
10
-
11
-
12
-
13
-
14
-
15
-
16
-
17
-
18
-
19
-
20
-
21
-
22
-
23
-
24
-
25
-
26
-
27
-
28
-
29
-
30
-
31
-
32
-
33
-
34
-
35
-
36
-
37
-
38
-
39
-
40
-
41
-
42
-
43
-
44
-
45
-
46
-
47
-
48
-
49
-
50
-
51
-
52
-
53
-
54
-
55
-
56
-
57
-
58
-
59
-
60
-
61
-
62
-
63
-
64
-
65
-
66
-
67
-
68
-
69
-
70
-
71
-
72
-
73
-
74
-
75
-
76
-
77
-
 78
78 -
 79
79 -
 80
80 -
 81
81 -
 82
82 -
 83
83 -
 84
84 -
 85
85 -
 86
86 -
 87
87 -
 88
88 -
 89
89 -
 90
90 -
 91
91 -
 92
92 -
 93
93 -
 94
94 -
 95
95 -
 96
96 -
 97
97 -
 98
98 -
99
-
100
-
101
-
102
-
103
-
104
-
105
-
106
-
107
-
108
-
109
-
110
-
111
-
112
-
113
-
114
-
115
-
116
-
117
-
118
-
119
-
120
-
121
-
122
-
123
-
124
-
125
-
126
-
127
-
128
-
129
-
130
-
131
-
132
-
133
-
134
-
135
-
136
-
137
-
138
-
139
-
140
-
141
-
142
-
143
-
144
-
145
-
146
-
147
-
148
-
149
-
150
-
151
-
152
-
153
-
154
-
155
-
156
-
157
-
158
-
159
-
160
-
161
-
162
-
163
-
164
-
165
-
166
-
167
-
168
-
169
-
170
-
171
-
172
-
173
-
174
-
175
-
176
-
177
-
178
-
179
-
180
-
181
-
182
-
183
-
184
-
185
-
186
-
187
-
188
-
189
-
190
-
191
-
192
-
193
-
194
-
195
-
196
-
197
-
198
-
199
-
200
-
201
-
202
-
203
-
204
-
205
-
206
-
207
-
208
-
209
-
210
-
211
-
212
-
213
-
214
-
215
-
216
-
217
-
218
-
219
-
220
-
221
-
222
-
223
-
224
-
225
-
226
-
227
-
228
-
229
-
230
-
231
-
232
-
233
-
234
 |
 |

86
Operating and financial review
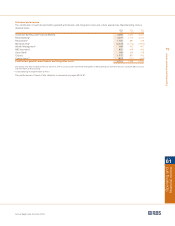
Wealth Management
2004 2003* 2002*
£m £m £m
Net interest income 497 457 451
Non-interest income 451 352 370
Total income 948 809 821
Expenses
– staff costs 299 259 279
– other 164 139 146
463 398 425
Contribution before provisions 485 411 396
Provisions for bad and doubtful debts – charge/(release) 17 9 (11)
Contribution 468 402 407
£bn £bn £bn
Loans to customers 9.2 7.9 7.3
Investment management assets – excluding deposits 22.3 22.3 16.1
Customer deposits 31.7 29.1 28.9
Weighted risk assets 8.3 9.1 8.4
* prior periods have been restated to reflect the transfer of certain activities to Retail Banking and Manufacturing.
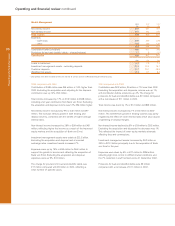
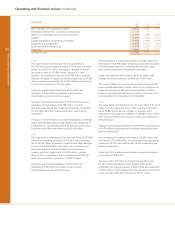
2004 compared with 2003
Contribution at £468 million was £66 million or 16% higher than
2003. Excluding the acquisition and adjusting for the disposal,
contribution was up 14%, £54 million.
Total income increased by 17% or £139 million to £948 million,
including a full year contribution from Bank von Ernst. Excluding
the acquisition and disposal, income was 12%, £94 million higher.
Net interest income increased by 9% or £40 million to £497
million. The increase reflects growth in both lending and
deposit volumes, combined with the benefit of higher average
interest rates.
Non-interest income increased by 28% or £99 million to £451
million, reflecting higher fee income as a result of the improved
equity markets and the acquisition of Bank von Ernst.
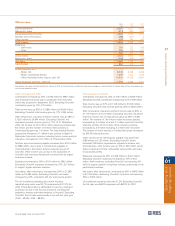
Investment management assets were stable at £22.3 billion.
Excluding the acquisition and disposal and at constant
exchange rates, investment assets increased 7%.
Expenses were up by 16% or £65 million to £463 million to
support the growth in income and reflecting the acquisition of
Bank von Ernst. Excluding the acquisition and disposal,
expenses were up 9%, £33 million.
The charge for provisions for bad and doubtful debts was
£17 million compared with £9 million in 2003, reflecting a
small number of specific cases.
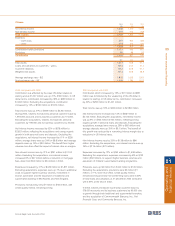
2003 compared with 2002
Contribution was £402 million, £5 million or 1% lower than 2002.
Excluding the acquisition and disposals, income was up 1%,
with contribution before provisions up 4%. The charge for
provisions for bad and doubtful debts was £9 million compared
with a net release of £11 million in 2002.
Total income was down by 1% or £12 million to £809 million.
Net interest income increased by 1% or £6 million to £457
million. The benefit from growth in lending volumes was partly
negated by the effect of lower interest rates which also caused
a tightening of deposit margins.
Non-interest income declined by 5% or £18 million to £352 million.
Excluding the acquisition and disposals the decrease was 1%.
This reflected the impact of lower equity markets adversely
affecting fees and commissions.
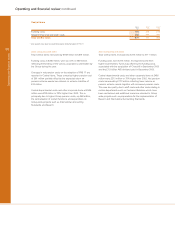
Investment management assets increased by £6.2 billion or
39% to £22.3 billion principally due to the acquisition of Bank
von Ernst in the year.
Expenses were down by 6% or £27 million to £398 million
reflecting tight cost control in difficult market conditions and
the 7% reduction in staff numbers since 31 December 2002.
Provisions for bad and doubtful debts were £9 million
compared with a net release of £11 million in 2002.
Operating and financial review continued